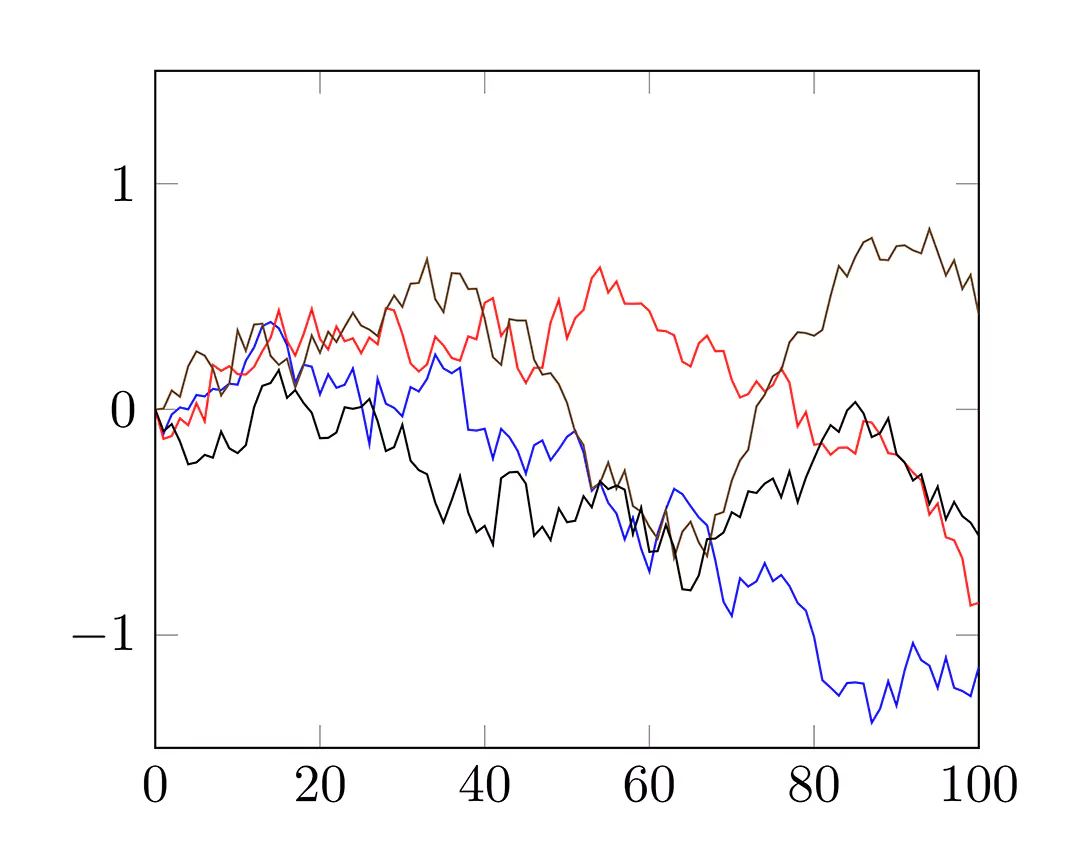
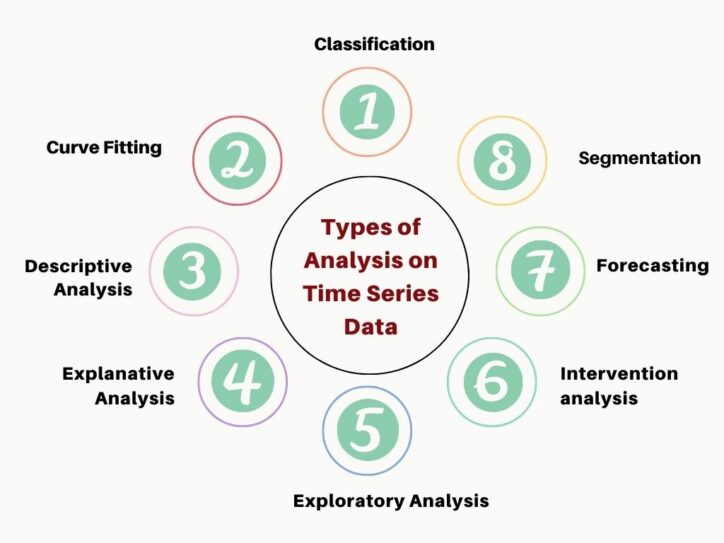
Time series analysis produces a series of information in a specific sequence, so it is not the same as other analyses.
The added advantage of such analysis is that it takes responsibility for a smoother data-cleaning process in a business. Time series Analysis is an important and valuable source of information for a wide range of applications.
As the volume and complexity of this data continue to grow, so will the demand for experts who can effectively analyze and interpret this data.
What does Time Series Analysis mean?
This is a sequence of data points collected over a period of time, which helps professionals to track changes over time & spot trends. These changes include milliseconds, days, and years.
With the help of time series data, professionals can gain deeper insights, and make the right decisions.
Let’s look at some real-time examples of time series data, and how it also helps businesses in decision-making.
Financial Markets
Firstly, it can be used in financial sectors like stocks, wealth management, and cryptocurrencies.
Here, data science professionals analyze how prices dropped or increased over time and identify trends. With this data, they can understand the present and past costs of the asset.
Application Monitoring
Imagine you’re maintaining a web application. Whenever a new user logs in, you update a “last_login” timestamp for such a user in a single row in the “users” table.
What happens if you consider each login as a separate event, and collect data over different time periods? Difficult to imagine, right?
In such cases, you can analyze past login activity, observe web application usage over a time period, and also track users based on how often they use the application.
Observability
Another best example includes operational metrics for web servers, networks, and applications. This data is very important to keep the services uninterrupted.
IT teams can effortlessly find problems by spotting changes in every metric and make decisions in case of a change in user behavior due to application updates.
Web3 and blockchain data
Nowadays, companies started building Web3 and blockchain tools using Timescale DB.
Blockchains consist of both time-stamped blocks, and transactions. There are numerous types of data to be collected for making smarter decisions in this sector.
You can also consider different examples such as mining analytics, criminal investigations, blockchain exploration, and so on.
Use Time Series Analysis to Predict Changes in Customer Demand for eCommerce
What is the difference between time series data and non-time series data?
Non-time series data is any data that is independent of any form of timestamp or timeline like Geographical data.
Whereas, in Time Series data, the dependent component is the time factor, i.e., the independent variable is time and there is at least one dependent variable that depends on that time variable.
Weather data is a good example of time series data.
Why Do You Need Time Series Database(TSDB)?
The following reasons made time series database the fastest; and most powerful category of databases:
- Scale
- Usability
Scale:
Time series databases (both NoSQL and relational-based) establish efficiencies that are possible if time is considered a first-class citizen.
These will let them provide huge scale from improving performances such as faster queries, and higher ingest rates at scale to enhance data compression.
Usability:
Time Series databases usually have built-in operations, and functions like time series data analysis including continuous aggregate queries, data retention policies, and flexible time bucketing.
These features can improve user experience, and make data analysis tasks smoother than before.
Hence, developers prefer to adopt TSDBs, and use them for different use cases:
- Tracking customer behavior data
- Monitoring machinery, connected devices, and equipment
- Tracking KPIs and growth of the business
- Tracking vehicles, physical containers, and trucks
- Monitoring virtual machines, containers, and software applications
Importance of Time Series Analysis in Business
Business owners use time series analysis to see seasonal trends and understand the underlying reasons for their occurrence. Businesses can use time series forecasting to predict the probability of upcoming events.
Time series forecasting can highlight possible modifications in the data such as cyclic or seasonal behavior, which helps in better forecasting by offering a clear idea of data variables.
Different Methods of Time Series Analysis
There are various fields in which time series analysis is applied and for different fields, there are different time series analysis methods. Some of them are mentioned below:
For Example, Time Series methods applied in the field of physics or economics can be:
- Frequency Domain Method: It involves both spectral, and wavelet analysis.
- Time Domain Method: It involves both autocorrelation and cross-correlation.
Moreover, for the fields where data may have some distribution or structure, the time series analysis technique can be classified as:
Parametric Approach: For data with fixed parameters like normal distribution-based data having mean and standard deviation.
Non-parametric Approach: For data that isn’t solely based on parameters, may be distribution-free or have a specified distribution but with the distribution’s parameters unspecified.
For other general fields where output depends on the number of input variables and their nature, the time series analysis is divided into:
- Linear
- Univariate
- Non-linear, and
- Multivariate
Time Series Analysis vs Time Series Forecasting
Time series analysis involves different methods for analyzing data to extract useful statistics, and other characteristics related to the data.
Whereas, time series forecasting involves the prediction of future values as per previously seen values using the time series model.
What are the Various Models of Time Series Forecasting?
It is already known that time series models are predominantly used to predict events as per the verified past data.
The most common forecasting models include Moving average, smooth-based, and ARIMA.
The surprising thing is that all of these models produce different outcomes for the same dataset.
Hence, it’s challenging to identify which model works fine according to the respective time series. It’s important to understand goals before forecasting.
Before you reduce the number of chances of predictive analytics problems, you should notice the following things:
- Availability of huge volumes of data: More data offers plenty of chances for exploratory data analysis, model fidelity, and both tuning and testing of models.
- Required time intervals for predictions: Higher time zones are more difficult to predict than shorter ones.
- Update forecast on time: Update forecasts frequently.
Let’s look at numerous time series forecasting methods:
Moving Average model (MA process): It is the most seen method for modeling univariate time series. This model indicates that the output variable relies linearly on the present and numerous historical values of a stochastic term.
Smooth-based model: It is a statistical method that removes outliers from a set of time series data to make a pattern clearly visible.
A certain type of irregular variation is inherent in the compilation of data taken over time. Smoothing data eliminates irregular variation and displays basic cyclic components and trends.
Examples of Smooth-based models are Simple Smoothing, Exponential Smoothing, etc.
ARIMA and SARIMA models: In order to understand ARIMA, it’s important to know what is Autoregression.
Autoregression is one of the time series models that make use of observations from past time steps as input to a regression equation to forecast the value at the next time step.
In the Arima model, the forecasts correspond to a linear combination of previous values of the variable.
However, in a Moving Average model the forecasts correspond to a linear combination of previous forecast errors.
The ARIMA model involves autoregression and moving average models. Since they need the time series to be stationary, integrating or differentiating the time series may be a mandatory step.
The SARIMA (Seasonal ARIMA) model involves the expansion of ARIMA by integrating a linear combination of previous forecast errors or seasonal values.
Use Time Series Analysis to Predict Changes in Customer Demand for Retail
Time Series Forecasting & Use Cases
Time series forecasting is one of the popular data sciences techniques in business, production and inventory planning, finance, and supply chain management.
Prediction problems that have a time component need this technique. Time series forecasts are mainly used to forecast a future classification at a specific point in time.
Let’s look at some use cases of time series forecasting:
Demand forecasting for dynamic pricing and retail
Predicting customer expectations or demand is always a challenging thing for businesses that handle supplies and procurement.
Another application is predicting rates or prices of products/services that dynamically adjust rates/prices based on revenue targets or demand.
Predicting prices for customer-facing apps and improving customer experience
Price prediction concepts in time series forecasting will create lots of opportunities for enhancing and personalizing the customer experience.
Anomaly detection for fraud detection
Anomaly detection in machine learning includes observation of outliers in the way data points are distributed.
In short, this process consists of the identification of irregular spikes that remarkably deviate from the way both trends, and seasons look.
Fraud detection is a major issue for any sector dealing with financial operations and payments.
Time series analysis in combination with ML can find suspicious activities such as modifications in the shipping address or massive amounts withdrawn to indicate fraudulent transactions.
Conclusion
The success of any business depends on how they use analytics for growth. The time series not only tracks the business’s success but also captures specific non-stationary, seasonal, and time-based events.
Express Analytics offers time series analysis and different statistical solutions to all types of businesses. Our experienced data science professionals analyze all datasets accurately and help businesses in making better business decisions.
Build sentiment analysis models with Oyster
Whatever be your business, you can leverage Express Analytics’ customer data platform Oyster to analyze your customer feedback. To know how to take that first step in the process, press on the tab below.
Liked This Article?
Gain more insights, case studies, information on our product, customer data platform


No comments yet.