Customer Segmentation: The dividing of a market’s customers into subgroups in a way that optimizes the firm’s ability to profit from the fact that customers have different needs, priorities, and economic levers.
For companies looking to effectively scale their customer base, it is inefficient to simply use a one-size-fits-all marketing approach for a diverse group of customers.
Customer segmentation attempts to divide and classify the customer base with respect to various parameters to identify the best performing subgroup of customers and then target customer segments most similar to our best performers.
Definition of Customer Segmentation
The process of subdividing a market’s customers in a way that optimizes the potential profit from the fact that customers have different needs, priorities, and economic levers is called customer segmentation.
If a company wants to efficiently scale its customer base, using a one-size-fits-all marketing approach is inefficient.
Segmentation attempts to identify the best-performing customer base by dividing and classifying it based on various parameters and then targets customers that are similar to those customers.
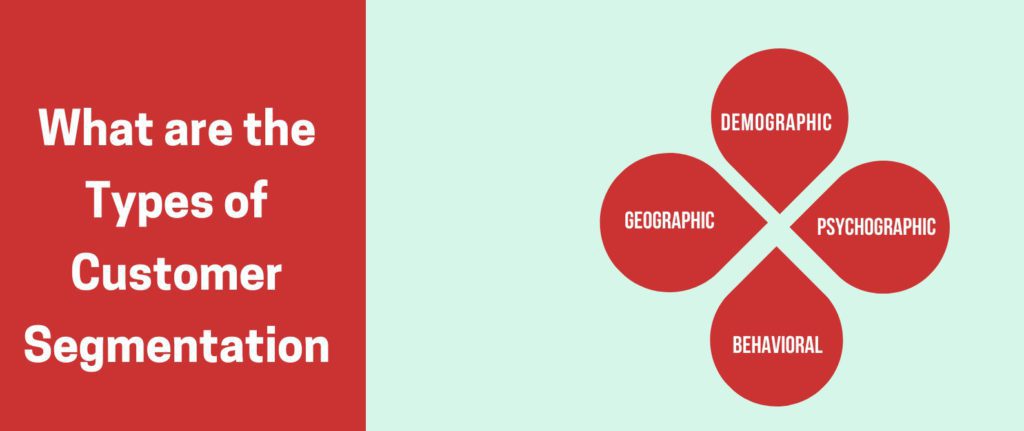
Customer segmentation divides the customer into groups based on different factors and where each group shows some unique characteristics of customers in that group.
It has been widely used by businesses to know more about their customers and their purchasing patterns to meet their needs by changing the business strategies accordingly.
How to Perform Customer Segmentation Using Machine Learning?
Machine learning (ML), a sub-discipline of artificial intelligence (AI) works as a magic tool for customer segmentation because manual customer segmentation can take months or even years based on the amount of data.
There are various unsupervised machine learning algorithms used for segmentation like K-means, K-Prototype, K-Modes, DBSCAN, BIRCH, etc. All these techniques come under a methodology called “Clustering”.
Can we Automate the Customer Segmentation Process?
The literature says the customer segmentation process can’t be “develop once and use forever” as data may change and the same steps can’t work.
But Express Analytics has automatized the customer segmentation process by creating a pipeline that can give recommended segments, and these segments can be changed based on the attributes selected by the user.
Creating a supervised learning pipeline is rather easy than an unsupervised learning pipeline as data is labeled in supervised learning. We are using clustering (unsupervised learning process) for customer segmentation.
It has the following steps:
1. Data Aggregation: The user selects the attributes on which they want to perform segmentation. These attributes are then converted into a dataset and become input for the pipeline.
2. Data Pre-processing: There are various key steps in data preprocessing like:
Missing Values: If we work on data individually, we can impute the missing values or drop some of them based on their effect on the whole dataset. But, while automatizing, we can’t look deep into the dataset and decide whether to impute or drop those values. So, to make it simple, we are dropping the columns which have null values.
Duplicate Values: There can be multiple transactions for a single customer id. But these duplicate customer ids are of no use while clustering. So, we have dropped the duplicates on the basis of customer ID attributes.
Unique Values: In a dataset, the columns which have more unique values are not usually suitable for clustering. So, to know which columns have the most unique values, we found out the number of unique values in each column and then discarded those columns which had more than 75 percent of unique values or only 1 unique value.
3. Data Types: A dataset may contain numerical(int, float), categorical (object), and DateTime columns. Most unsupervised learning algorithms work on numerical data, so we need to convert categorical columns into numerical data. We are dropping DateTime columns for now as they may be audit dates etc., which will be of no use.
How to Convert Categorical Data to Numerical Data?
Categorical to Numerical data conversion: K-means is the most commonly used clustering technique but it only works with numerical data. So, we have to convert categorical data into numerical data. There are many ways of doing this customer segmentation.
Some of them are:
a. One Hot Encoding: This type of encoding is done where values are nominal. It creates different columns for each unique value of a categorical variable. The advantage is that it is easy to apply and it can be inverse transformed also. However, it increases the curse of dimensionality.
b. Label Encoding: This encoding is mainly for ordinal columns where the order of the values has to be maintained. It converts the categorical values into integer numbers. Its use is not advised for nominal values.
c. Binary Encoding: This encoding uses one-hot encoding with hashing. Here, the categorical features are converted into numeric values which are then converted into binary values. This is a memory-efficient encoding scheme.
d. Base N Encoding: This encoding is the same as Binary encoding. The only difference is hashing is not done with base 2, it can be with any base. This encoding is good when there are more categories.
4. Model Implementation: There are various clustering techniques mentioned in the literature where K-Means are the most common among them. However, it only works with numerical data. K-Modes is the technique used only with categorical data.
Now, to work with both numerical and categorical data, the K-Prototype clustering technique comes into the picture. We have used K-Means and K-Prototype for customer segmentation.
K-Means: To use K-Means, we converted the categorical columns using Binary encoding as there can be multiple unique values in a column and one-hot encoding will increase the dimensionality.
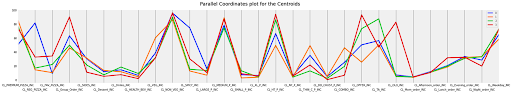
We scaled all the data using the StandardScaler function so that there is a standard mean and variance. The results of K-means are visualized using a parallel coordinate approach where the centroids of each cluster are taken and plotted parallelly.
The Elbow method is used to find the optimal number of clusters.
Figure: Parallel Coordinate plot for centroids using K-Means
K-Prototype: It works with both numerical and categorical data. Here, we don’t need to convert categorical data, we can just mention which are the categorical columns in the whole dataset.
As it works with categorical columns itself, its training time is more than K-Means. It can also be visualized using cluster centers. The Elbow method can be used to find the optimal number of clusters.
Once clusters are assigned to each customer, the visualization explains the distinguishable segments defining the behavior of different customers.
Sometimes, the clusters produced by K-prototype are more informative than K-Means and it can also reduce the extra effort of converting categorical columns.
Benefits of Customer Segmentation
Through customer segmentation model, a company can target specific groups with marketing campaigns tailored to their needs and in a way that will resonate with the targeted segment, but not necessarily other segments.
Customers are commonly segmented based on various parameters, namely:
Needs – depending on what kind of products will satisfy the customers
Spending behaviour – based on their spending behaviour like high spenders, value for money seekers etc, how often the customer makes purchases etc.
Monetary value – how much revenue does the company make from these customers
Recency – how recent are these customers, how often do they make purchases
Demographics – the age, gender, ethnicity, religion of customers, etc.
Through customer segmentation, the marketing strategy used to target different segments can be optimised by:
Identifying the optimal channel for marketing to the customer segment – catalogue, phone, email, flyer, etc..
Marketing products to the segment which will be of interest to them.
Leverage pricing options depending on the spending habits of the segment.
Focusing marketing resources on most profitable customers to improve ROI.
CLV-Focused Customer Segmentation
One popular and perhaps the most effective method (according to a study conducted by Libai, Narayandas, and Humby in 2002) that companies use to segment their customers is based on a parameter called Customer Lifetime Value and aims to identify the most profitable customers.
Customer Lifetime Value of a customer is the total revenue generated from the customer over a lifetime of purchases and deducting the costs incurred in customer acquisition, while also accounting for the time value of money by segmenting customers based on CLV, an organization can target its most profitable customers resulting in maximization of marketing ROI.
CLV segmentation shifts the focus from targeting customers to leveraging marketing resources to target the most profitable customer segments.
Oyster CDP’s Customer Segmentation
Oyster CDP from Express Analytics combines the advantages of CLV-based segmentation along with indicators of behavior and demographics to identify the most profitable segments for marketers. This approach leads to the maximisation of RoI on marketing spend.