Data Visualization
Services
Express Analytics' Approach
Why Choose Express Analytics?
We offer comprehensive data visualization solutions that transform complex data into clear, actionable insights. Our advanced visualization capabilities include interactive dashboards, real-time reporting, and custom visualizations designed to help businesses make better decisions and communicate insights effectively.
Our Services
Data visualization solutions include
Transform complex data into clear, actionable insights with Express Analytics' data visualization solutions built for business leaders and data teams.
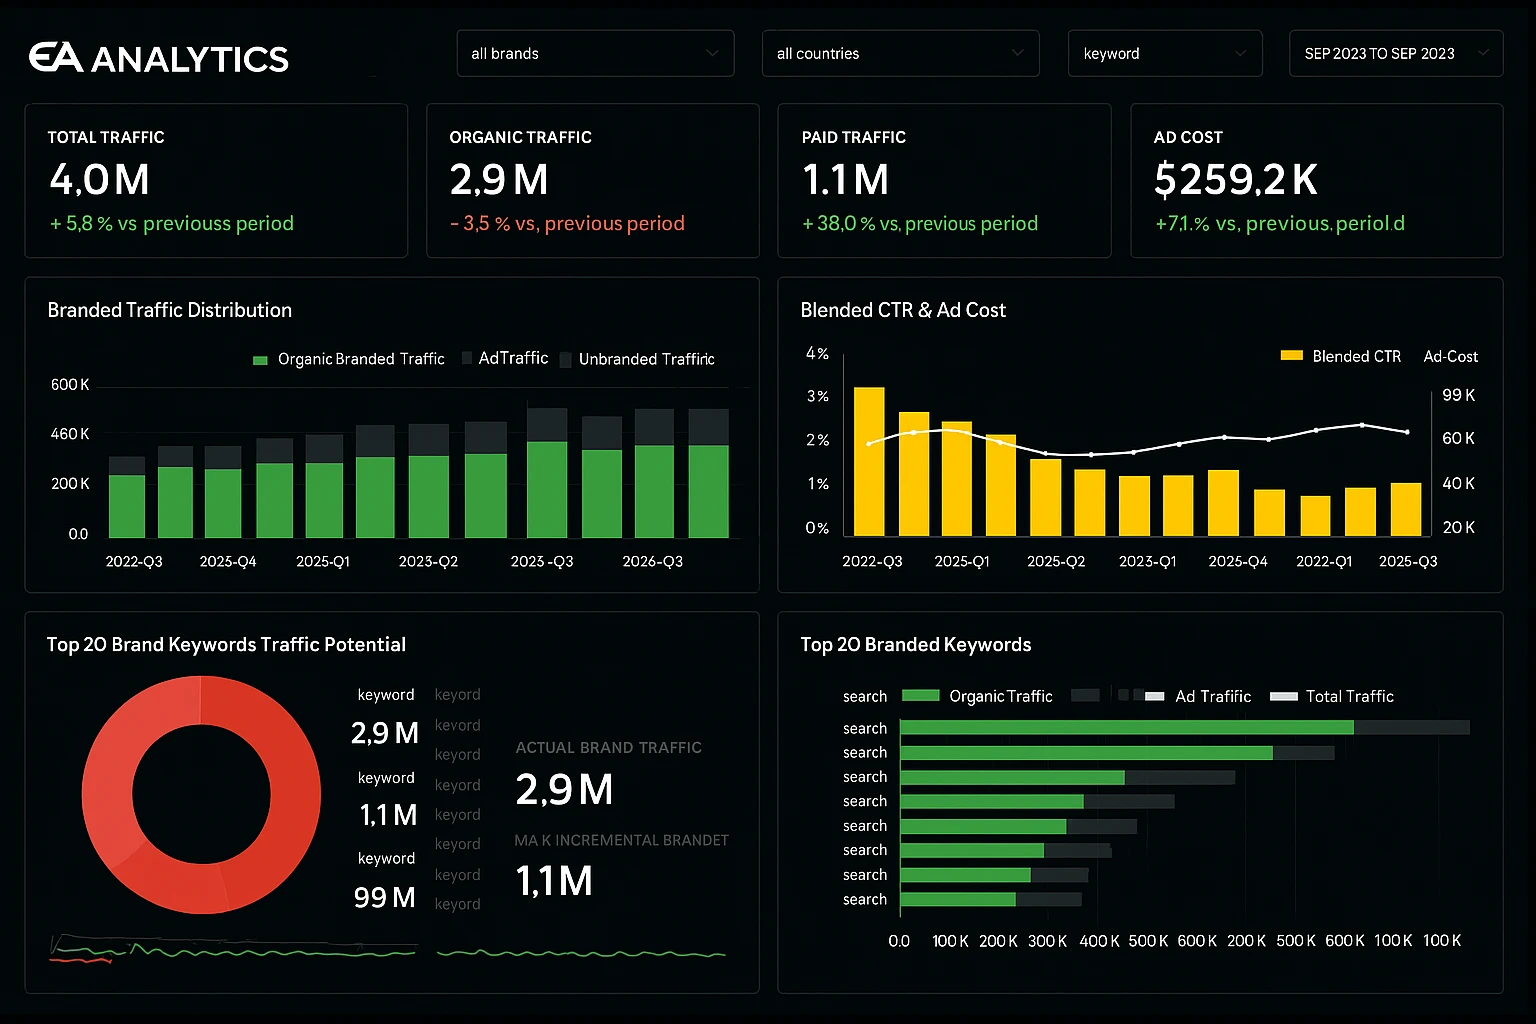
Interactive Dashboards
Create dynamic, real-time dashboards that provide instant insights into your business performance and key metrics.
Custom Visualizations
Design tailored charts, graphs, and visual elements that effectively communicate your unique data story.
Real-Time Reporting
Generate automated reports that provide timely insights and keep you informed about critical business metrics.
Data Storytelling
Transform raw data into compelling narratives that engage stakeholders and drive informed decision-making.
Performance Analytics
Track and visualize performance metrics to identify trends, patterns, and opportunities for improvement.
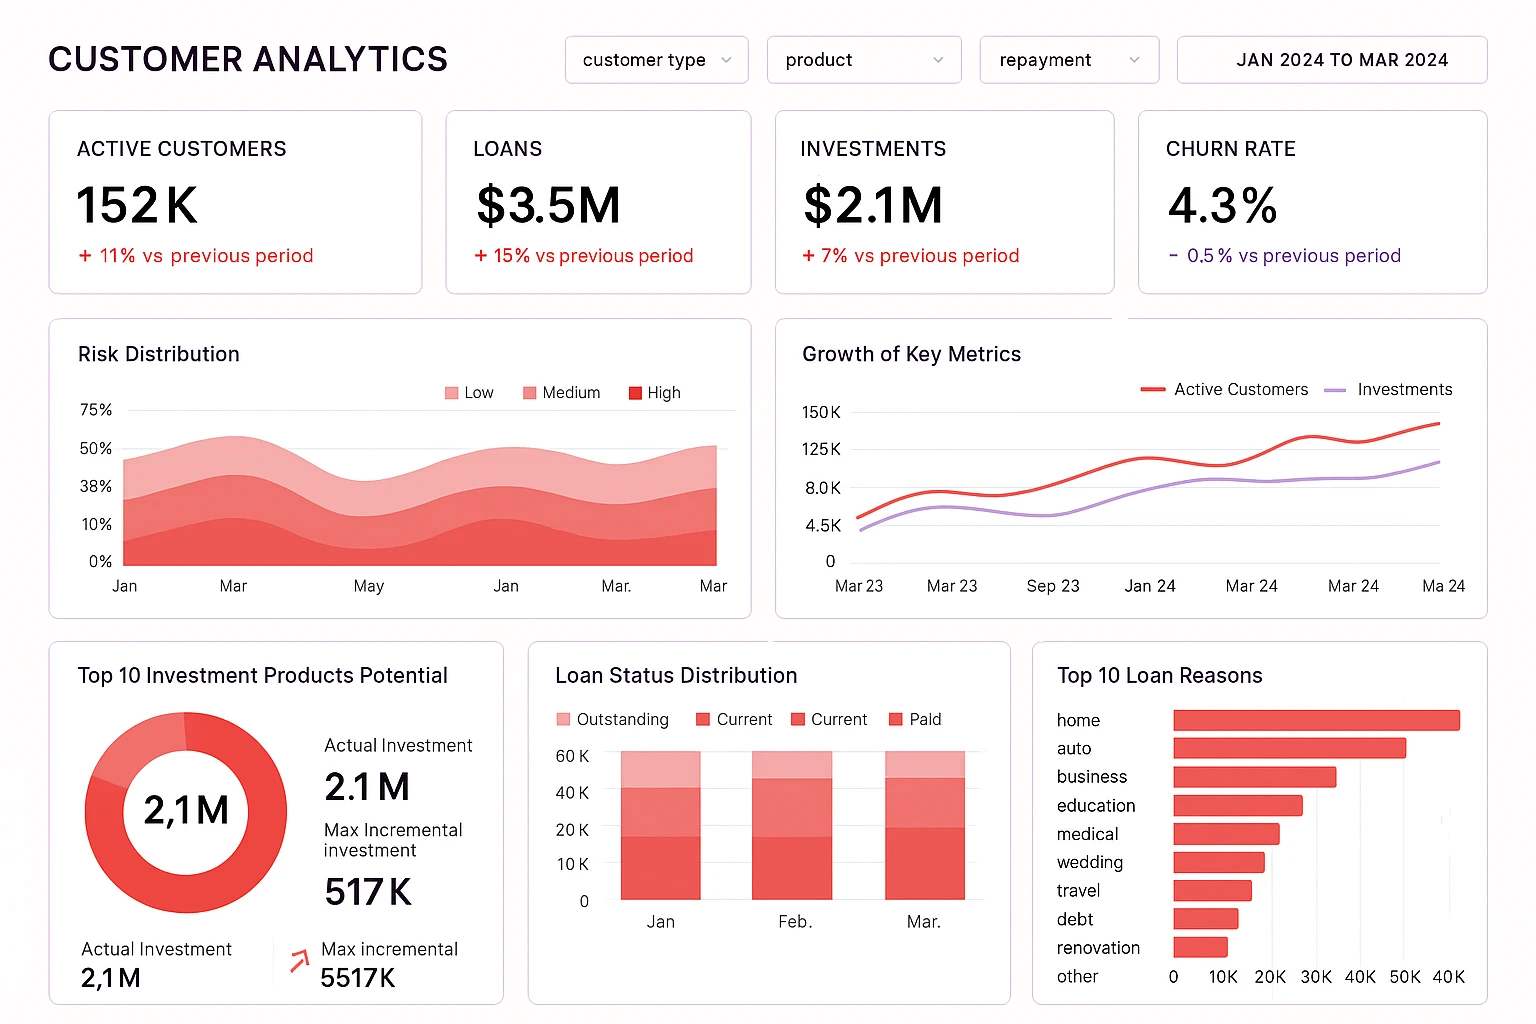
Business Intelligence
Leverage advanced BI tools to uncover insights and drive strategic business decisions.
Data Visualization Performance Analytics
Interactive Dashboards
Create dynamic, real-time dashboards that provide instant insights into your business performance.
Custom Visualizations
Design tailored charts and graphs that effectively communicate your unique data story.
Real-Time Reporting
Generate automated reports that provide timely insights and keep you informed about critical metrics.
Data Storytelling
Transform raw data into compelling narratives that engage stakeholders and drive decisions.
Performance Analytics
Track and visualize performance metrics to identify trends and opportunities for improvement.
Business Intelligence
Leverage advanced BI tools to uncover insights and drive strategic business decisions.
Who needs data visualization?
Read about how we work and then let's book a call to chat about your project.
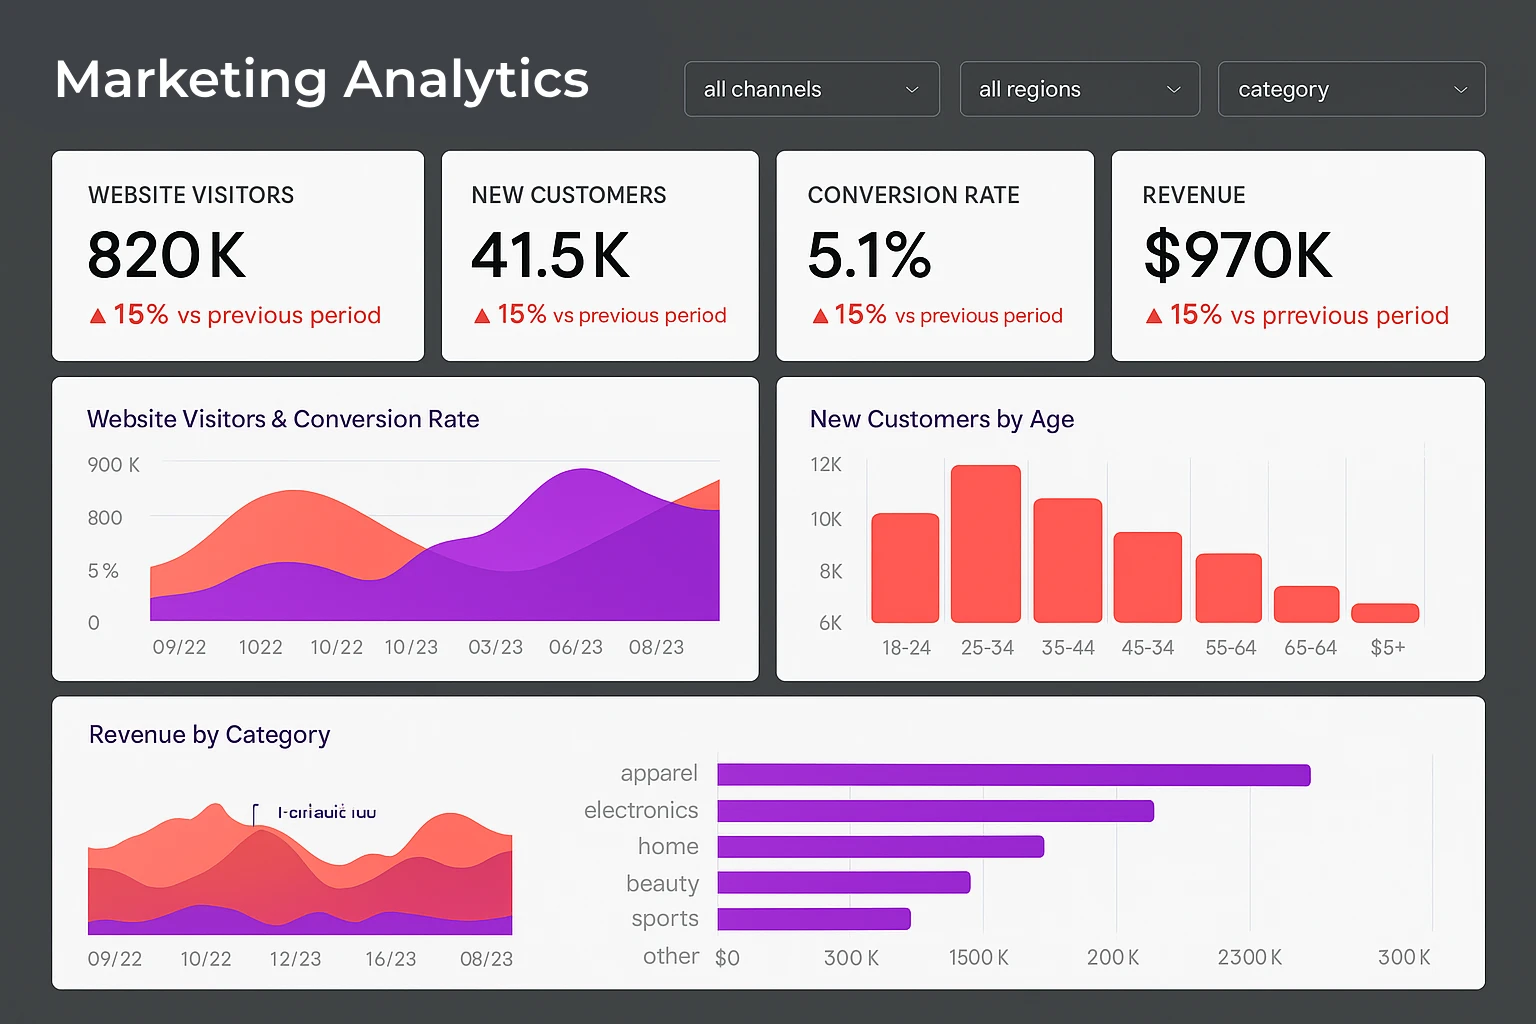
Marketing Teams
Visualize campaign performance, customer insights, and ROI metrics to optimize strategies and improve results.
Sales Organizations
Track sales performance, pipeline metrics, and customer data to identify opportunities and improve conversion rates.
Operations Departments
Monitor operational efficiency, process performance, and resource utilization to optimize workflows and reduce costs.
Executive Leadership
Access high-level dashboards and reports to make informed strategic decisions and track business performance.
Frequently Asked Questions
Our data visualization platform is built to help you work smarter, not harder. It adapts to your needs and supports your goals. Make the most of every feature.
Who Can Benefit from Data Visualization?
Discover how different organizations leverage our data visualization solutions to drive growth and achieve their business objectives.

Marketing Teams
Visualize campaign performance, customer insights, and ROI metrics to optimize strategies and improve results.

CMOs & Business Leaders
Access high-level dashboards and reports to make informed strategic decisions and track business performance.

Digital Marketing Agencies
Provide clients with advanced visualization capabilities and demonstrate campaign effectiveness with detailed reporting.

E-commerce Businesses
Optimize marketing spend and improve conversion rates through data-driven insights and visual analytics.

B2B Companies
Improve lead generation and sales pipeline performance with targeted analytics and visual insights.

You Have Questions, We Have Answers
Need help with something? Want a demo? Get in touch with our friendly team and we'll follow-up within 2 hours
Tell Us What You Need
Our team is ready to assist you with every detail, big or small.
Related Services

Customer Segmentation
Group your audience intelligently for more effective marketing campaigns and personalized experiences.

Lookalike Modeling
Find and connect with potential customers who behave like your best target audience segments.

Sentiment Analysis
Analyze customer feedback and social media to understand customer emotions and satisfaction levels.

Predictive Analytics
Forecast customer behavior and market trends with advanced machine learning algorithms.

Churn Prediction
Identify at-risk customers early and implement targeted retention strategies to reduce churn.

Data Reporting & Visualization
Transform complex data into actionable insights with interactive dashboards and reports.

Data Cleaning Services
Ensure data quality and accuracy with our comprehensive data cleaning and validation services.

Business Intelligence Analytics
Drive strategic decisions with comprehensive business intelligence and analytics solutions.