How to Detect Outliers in Data Wrangling: Examples and Use Cases
Outliers is the term that strikes your mind whenever you speak about analyzing data. If you are planning to inspect any task to examine data sets, you can make assumptions about the methods used to produce the data.
If you come across a few data points that are probably erroneous in some way, then these are obviously outliers. Based on the situation, you have to correct such errors.
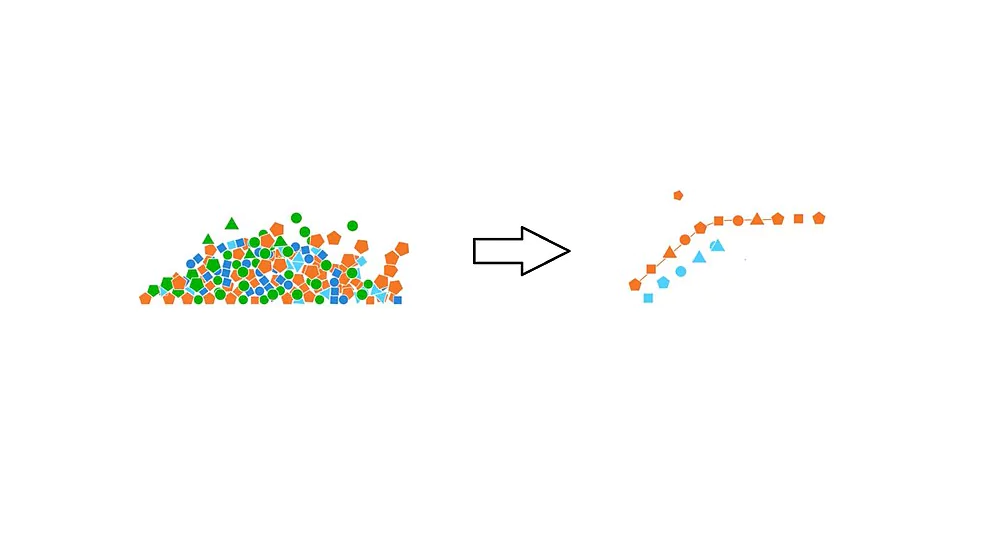
Outlier Detection: Detection of outliers is a very important part of the data wrangling process. Outliers are those values of an attribute which lie far off from the majority values present for that attribute.
Outliers can cause a statistical or machine learning model to perform poorly. It’s because they do not fall within the normal range of values for that attribute.
For outlier detection methods we need to know the 1st (Q1) and+ 3rd (Q3) quartile of that numerical attribute.
Then we can calculate the Interquartile Range (IQR) as follows :
IQR = Q3-Q1.
If any value falls outside the normal range for that attribute, it is an outlier. The formula for normal range:
[Q1 – (1.5 * IQR), Q3 + (1.5 * IQR)]
The Python Boxplot images show difference between value ranges of “Price” ($) attribute, before and after the removal of outliers.
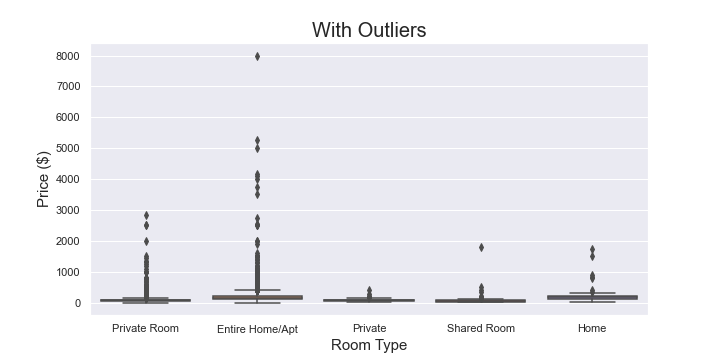
As we can see, that the “Maximum Price” value in the 1st graph was $8000 and the there were a lot of outliers present in the data.
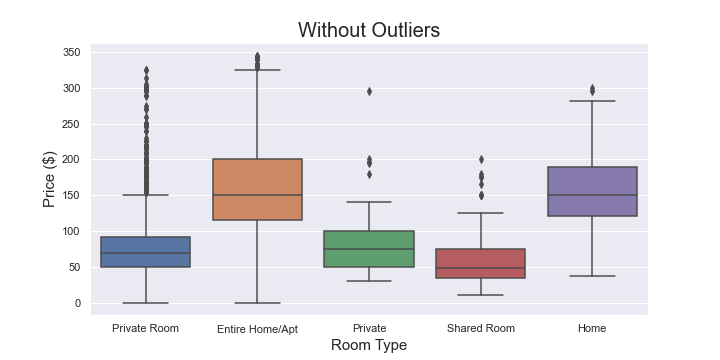
After the removal of outliers, the “Maximum Price” value in the 2nd graph became $350. For this attribute, we had Q3 = $180, Q1 = $69 and IQR = $111.
Detect and manage outliers in data wrangling efficiently. Talk to our experts for machine learning solutions
Business Use Cases
Outlier detection methods are used across industry for different purposes, namely fraud detection, traffic monitoring, web fault detection, building of intrusion detection systems, etc.
For example, banks can provide us with their customer transaction data, where we are supposed to identify customers who look suspicious based on their transaction records.
In this case, if we observe the average transaction amount of the customers based on a certain time span and plot the data, we can easily identify the customers whose average transaction amount looks quite off as compared to the other customers.
Then, we can alert the bank about those customers so that they can make further detailed inquiries about their transaction details.
Standardization of Textual Data in Python
In many cases, we perform comparison based on textual data. A common issue observed here is lack of a standard data format for string type attributes.
For example, we might not be able to detect the same words if one starts with a capital case letter and the other does not. To overcome this, we should standardize the strings.
We can convert all of them to upper case or lower case. Also, we should perform data cleaning (major part of data wrangling) of textual data to make sure that the same format is followed across different datasets.
Data cleaning example of two dummy datasets
Below is an example of two dummy datasets. One contains the height records (feet) and the other contains Date of Birth records for 5 different actors.
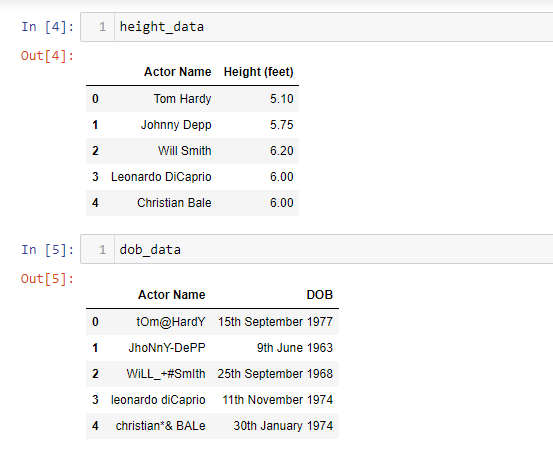
As we can see, the values in the “Actor Name” column in the “Height” dataset look correct. But in the DoB dataset it contains unwanted characters.
So if we try to create a single dataset by joining these two datasets based on the “Actor Name” attribute, then we get an empty dataset. This is because the values in the “Actor Name” column need to match in the two datasets for the join to occur successfully.
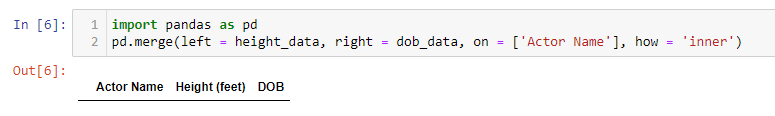
To resolve this, we need to clean the values in that column in the DoB dataset, and then try to join the two datasets. We will use the re-library of Python to implement Regular Expressions and come up with a cleaned set of text.
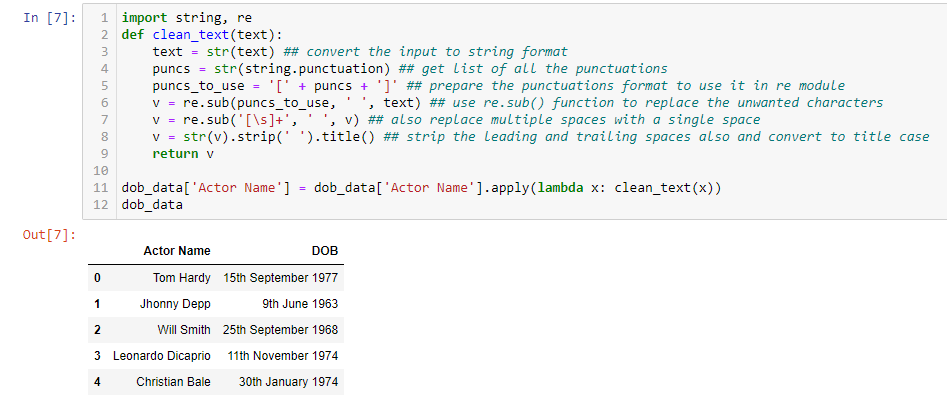
We also use the string library of Python to get all the punctuations of the English language.
Next, we need to create a Python function that takes a text as input, cleans the text and returns it. We then apply this function on the “Actor Name” column of the DoB dataset.
We also apply the same function to the “Actor Name” column of the “Height’ dataset to make sure that the “Actor Name” columns in both the datasets are standardized, and the connection occurs without any issue.
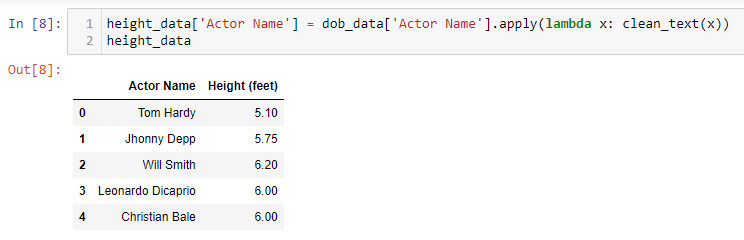
Finally, we join the two datasets based on the “Actor Name” column to get the final dataset. This time we see that we get the desired result, and not an empty dataset as before.
Date Manipulation
This is another important aspect of Data Wrangling use case. Almost every dataset contains an attribute related to date-time that provides us with useful information. So it is very important to use the different utility functions related to date-time and extract relevant information from it.
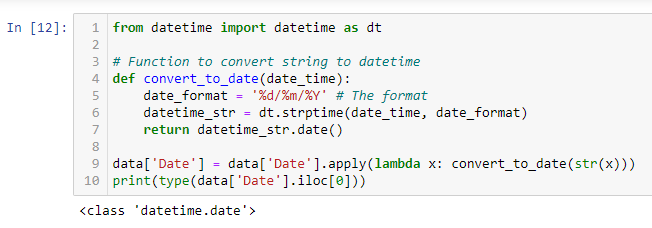
Below image shows the storage of date-time information in a dataset. As we can see, the dates are in STRING (or Textual) format and they need to convert to a Python DateTime format.
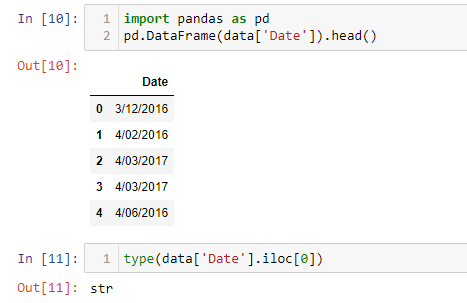
We create a Python function to convert the values of the date column from String to DateTime format. We apply that function and then check the data type of the Date column. Now the values got converted into DateTime format from String format.
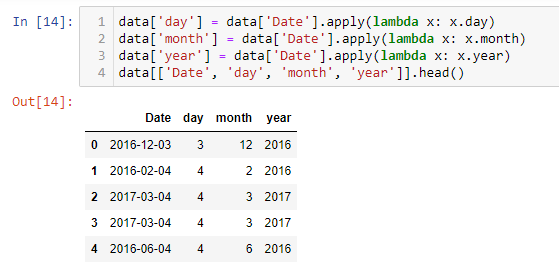
We can then extract the day, month and year information and store it in separate columns in the dataset for further analysis.
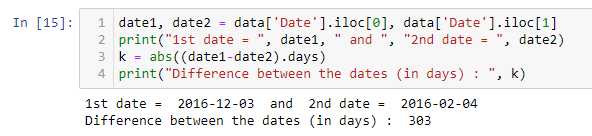
Also, we can find the difference between two dates in terms of number of days. This operation is very useful and can be useful for multiple purposes. Ex : Calculating and storing Customer Recency Information for e-commerce websites.
In conclusion: With the amount of data we generate almost every minute today, if more ways of automating the data wrangling process do not evolve soon, there is a very high probability that much of the data the world produces shall continue to just sit idle, and not deliver any value to the enterprise at all.
Build sentiment analysis models with Oyster
Whatever be your business, you can leverage Express Analytics’ customer data platform Oyster to analyze your customer feedback. To know how to take that first step in the process, press on the tab below.
Liked This Article?
Gain more insights, case studies, information on our product, customer data platform
No comments yet.