
Analytics Dashboards: Some Say The End Is Near, We Say Not So Fast
Analytics Dashboards: Some Say The End Is Near, We Say Not So Fast When a year comes to an end, there’s always a tendency to look back at the days gone by to analyze what certain developments mean for a certain industry or sector. So, as the curtains are set to come down in 2020,… Continue reading Analytics Dashboards: Some Say The End Is Near, We Say Not So Fast
Hemant Warudkar | 09 Jun 2021

The Many Routes From Data to Visualization
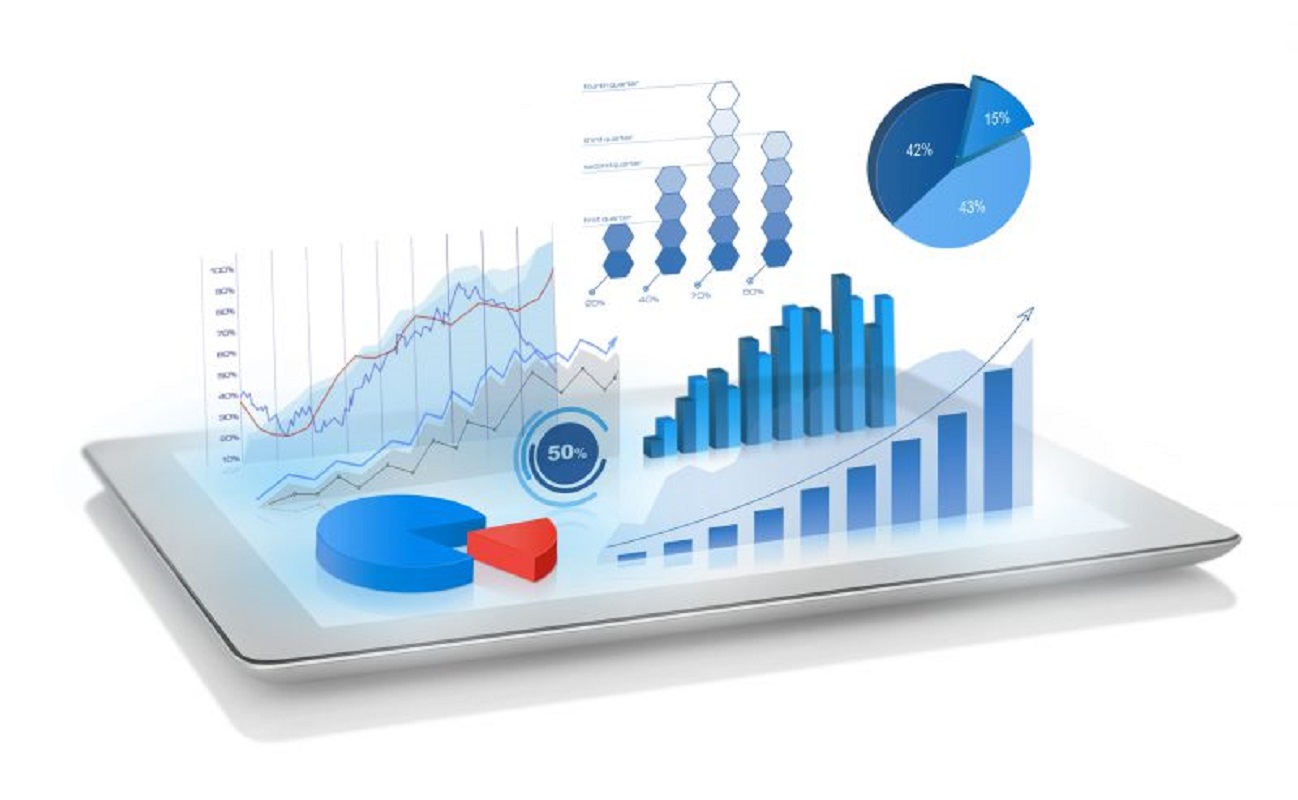
The Many Routes From Data To Visualization Data visualization makes it comparatively easy for the human brain to comprehend the information, but simultaneously, visualization also helps in detecting patterns and outliers in data sets. The increasing dependence on data has made it imperative to translate information into visuals (graphs) for better and faster consumption. The graphical… Continue reading The Many Routes From Data to Visualization
Hemant Warudkar | 17 Mar 2021
5 Popular Data Visualization Tools – A Slideshow
5 Popular Data Visualization Tools – A Slideshow
Hemant Warudkar | 17 Jul 2018

How Natural Language Processing is Helping Democratize Business Intelligence
A minuscule percentage of those in the business of providing BI solutions have adopted NLP and adapted it to generate results for Enterprise clients. While the figure may be small today, advancements in the field are bound to push the number up.
Hemant Warudkar | 29 Jan 2018

The State of Natural Language Processing Today
Readers of this blog may have realized that Natural Language Processing (NLP) was missing from our ‘5 Data Analytical Trends To Watch For in 2018’ post. Our in-house team of predictive data analysts say it lost out to the other trends by a narrow margin. But that in no way takes away from the importance of NLP and its growing influence in the world of big data analytics. The loser by a whisker surely deserves an honorable mention, hence this 2-part post.
Hemant Warudkar | 11 Jan 2018
Data Visualization Using Sankey Diagram
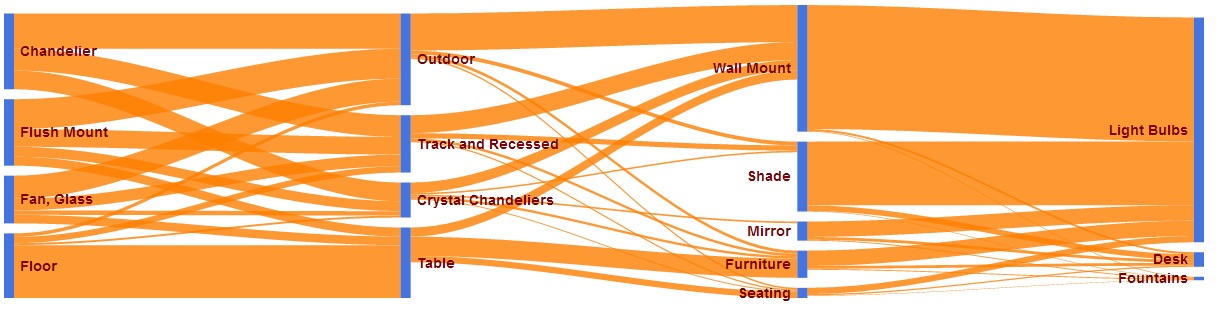
Data Visualization Using Sankey Diagram Data visualization offers the best approach for business owners or professionals to communicate data to audiences of non-technical backgrounds. It is one of the greatest ways to simplify the complexity of understanding relationships among data. Sankey Diagram is one such powerful technique to visualize the association of data elements. They are… Continue reading Data Visualization Using Sankey Diagram
Hemant Warudkar | 01 Jul 2014