Improving the Response Rates of Email Marketing
Everything in marketing is about being relevant to the context of the customer. Having said that, when we set out on achieving this lofty goal we run into several challenges. One of the major considerations is the definition of the size of the opportunity.
Let us assume that we email every one of our email list of 10 million members.
Let us define the email response rate in marketing parlance.
Response rate = several responders/number of impressions in the performance window.
Performance window can be defined as the time after the email reaches the inbox of the target audience. This can be as short as 24 hours or up to two weeks depending on the frequency of your waves of emails.
So let us say that
- we sent 10 million emails
- 500,000 people opened their emails
- and of these 5000 clicked at least one link in your email
- within the two weeks after we sent the email,
then our email response rate would be 5000/10,000000 = 0.05%.
We could also look at another important ratio here.
Click to Open Ratio = 5000/500,000 = 1%. These two response rates are typical of the email marketing numbers. Let us see why.
The general notion is to send more emails to increase the number of responders. However, by the definition, as the number of impressions increases the denominator of our formula increases thus reducing your email response rate.
Our executive management reviews the response rates and mandates that we do better, or perhaps we don’t share these rates with our management as they are too low and proactively decide to do something about the response rates.
[polldaddy poll=7273554]
Let us rethink our approach
If we take the same “spray and pray” technology of the newspaper, billboard era, then we have not made any progress. The best part about the digital world is that technology allows us to sense and measure more signals than was possible in the offline world. If we don’t take advantage of this measurement we haven’t made progress.
So let us think about narrowcasting rather than broadcasting. I want to make an offer only to those people who may be interested. That way I can keep my number of impressions to a minimum and improve the number of responders. However, wishful thinking alone doesn’t make this happen. We decide to think differently.
One of the team members has a bright idea,- why don’t we segregate our buyers from non-buyers? surely, they behave differently. Then the discussion drifts along the lines of demographics and geographic segmentation. These dimensions are easy to use, and so, we dive in headlong in this approach. But we soon discover that in the next couple of our campaigns the email response rates don’t budge. If you have been there, don’t worry, we all have been there.
A Better Approach – Segmenting the Customers
Let us start by looking at how we can understand the context of the buyer. We can start by segmenting the customers into several segments by the following attributes based on their past buying behavior. Some of them are:
- Buying stage
- Behavior
- Style preference
- Price Sensitivity
- Social acceptance
- Location
- Quality consciousness
- Recency
- Frequency
- Monetary
- Return behavior
- demographic
- Gender
- Channel preference
- Opt-In status
With Today’s technology, we can observe potential customers unobtrusively over a long period of time and collect data about them. Once we have done that for a while, we can start to group them into various clusters. Some clusters can be as follows: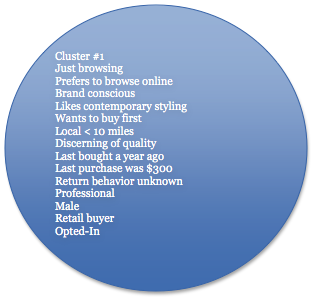
Cluster #1
Just browsing/prefers to browse online/brand conscious/likes contemporary styling/wants to buy first/local < 10 miles/discerning of quality/last bought a year ago/last purchase was $300/Return behavior unknown/Professional/ male/retail buyer/Opted-In
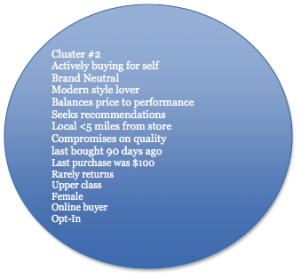
Cluster #2
Actively buying for self/Brand Neutral/Modern style lover/Balances price to performance/seeks recommendations/local <5 miles from store/compromises on quality/last bought 90 days ago/last purchase was $100/rarely returns/upper class/female/online buyer/opt-In
Such clusters once defined allow us to predict the future behavior of new members to the cluster. As we gather important clues about individual customers, we can start to plan separate campaigns to address every unique cluster.
Each of these listed variables influences buyer behavior to a varying degree. So, perhaps we can study the last two years of the behavior of this customer segment and calculate the rank of each variable by its influence on the buying behavior of the members.
We can also find the strength of influence of each variable on the outcome. This is the correlation between an individual variable and the outcome. So let us try to find an equation that can explain in mathematical terms, the influence of these variables on the outcome. Will the receiver respond or not? So we classify receivers based on their likelihood of response.
Once we have done this classification, we can calculate the probability of response. Now even within responders, there is going to be a probability of response by each receiver. So we need to rank the likely responders based on their probability of response (e.g. 0.85). Then we can create a cut-off threshold (let us say 0.75). Anyone with a probability above this threshold should be emailed, the rest of them can be safely ignored.
This is one part of the equation. We have identified the segments of customers we want to communicate with. THE WHO of our story is defined.
However, if we still need to establish the context of the receiver of our communication when we are going to email them. So we still need to try to explore the recent activities of the receiver. Our ability to track the receiver’s search terms, the visit to the various websites, the blogs visited, the products reviewed, the products they have pinned, the stores they have visited, give us their stage in their journey to purchase. This also gives us the clue about their stage in the buying cycle and what may be of interest to the receiver. This allows us to do some controlled experiments with the type of emails we can send them. It also answers the question -when is the best time to send them the emails.
This approach of using the data to guide us through the unknown territory of marketing new receivers is called Data Science. Using the historical data to analyze the habits of customers needs a scientific approach. It is methodical, time-consuming but the surest path to marketing success.
In a future blog, I will explore the world of subject line testing, the composition of the email, the contrast colors, the sizes of the images, the positioning of the call to action links. These activities make our emails more effective as marketing messages.
An Engine That Drives Customer Intelligence
Oyster is not just a customer data platform (CDP). It is the world’s first customer insights platform (CIP). Why? At its core is your customer. Oyster is a “data unifying software.”
Liked This Article?
Gain more insights, case studies, information on our product, customer data platform