How can you make complex data easier to understand? Visual elements are often more intuitive than intricate numeric values. Yes, extensive data-gathering allows for more reliable problem analysis. However, the data visualization approach is the most effective way to gather the data and highlight trends. So, enterprises, SMEs, educational institutions, and regulatory bodies must embrace the visual reporting methods to improve presentation.
This post will emphasize the power of data visualization that assists in turning complex data into actionable insights and how enterprises can benefit from data visualization.
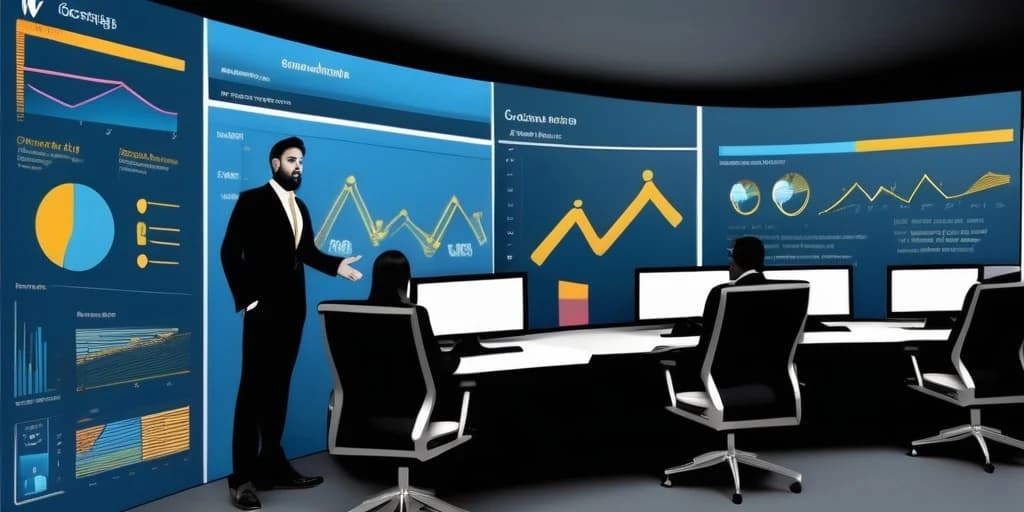
Understanding Data Visualization
Data visualization is the graphical representation of information and data. Using visual elements like charts, graphs, and maps, data visualization tools provide an accessible way to see and understand trends, outliers, and patterns in data. In today's data-driven world, effectively visualizing data is crucial for business success.
Why Data Visualization Matters
Cognitive Processing
- Humans process visual information 60,000 times faster than text
Decision Making
- Faster identification of opportunities and threats
Business Impact
- Increased operational efficiency
Data Visualization: Understanding Its Scope and Advantages
Data visualization tools excel at representing datasets and uncovering trends via graphical design assets.
It also preserves mathematical precision, making visualized reports more useful for business correspondence and problem-solving.
Several data visualization platforms often integrate diverse charts, maps, animations, and color schemes to depict changes in variables.
Similarly, observing data through the visualized reporting methods allows for quick conflict discovery and statistical anomaly detection.
Venn diagrams, for instance, help demonstrate overlapping values. Meanwhile, a sudden peak in a linear graph can pinpoint records that might skew the statistical metrics.
Therefore, analysts at top data analytics companies can recalculate them by properly ignoring or adjusting such extreme data points to reduce the risk of bias.
Explaining dataset trends with visualization-aided data storytelling will always trump spending hours number-crunching or skimming through thick and heavy project reports.
However, stakeholders can simplify those reports through static or animated infographics and similar media. They assist in describing multiple components in a simple style.
A quick look at most business-to-business (B2B) marketing campaigns will also reveal the increased use of infographics. They often boost audience engagement across social networking sites.
Besides, many thought leadership publications rely on these visuals to break down complex methods for broader audiences.
Types of Data Visualization
1. Charts and Graphs
Bar Charts
- Compare quantities across categories
Line Charts
- Display trends over time
Pie Charts
- Show proportions and percentages
Scatter Plots
- Show correlation between variables
2. Advanced Visualizations
Heatmaps
- Display data density and patterns
Tree Maps
- Show hierarchical data structures
Network Diagrams
- Show relationships between entities
Geographic Visualizations
- Map-based data representation
Why Does Data Visualization Matter in Brainstorming and Creative Problem-Solving?
Academic inquiries into effective information retention by learners indicate the superiority of visual means of knowledge sharing.
For example, Larkin and Simon’s paper from 1987 titled ”Why a diagram is (sometimes) worth ten thousand words” discusses how diagrams simplify information conveyance for educational and problem analysis use cases.
Likewise, many scholars continue to explore the role of sketches, geometric shapes, and photographic elements in cognitive science, memory retention, or communication.
Today, most project scheduling and conflict assessment software includes flow charts and network diagrams. These data visualizations also allow for the inclusion of process-critical metrics.
For instance, you could add annotations describing resource consumption, responsible parties, and delivery delays. That is why it becomes easier for project managers to brainstorm ideas for resource planning and address potential conflicts early on.
According to Autodesk, a leader among industrial design and documentation program providers, engineers now simulate how each structural unit will behave during an earthquake, snowstorm, heavy rainfall, and tornado using color-graded 3D models of real-world infrastructure.
Similar applications in product testing and ergonomic design are abundant.
As global enterprises seek innovative ways to transform technical documentation into user-friendly brochures and self-help guides, the importance of inclusive data visualization tools will continue to grow.
Remember, the cognitive efficiency of persons well-versed in a highly technical field will be remarkable when they encounter jargon-heavy content.
On the other hand, the target audience’s ability to interpret jargon or complex ideas will not be the same. That is why responsible data storytelling professionals must use visualized reporting methods, considering the audience’s knowledge level or subject familiarity.
The Role of AI in Modern Data Visualization
Automated Insights
Pattern Recognition
- AI algorithms identify hidden patterns
Natural Language Generation
- Automated report generation
Smart Recommendations
- Suggest optimal chart types
Interactive and Dynamic Visualizations
Real-Time Updates
- Live data streaming and updates
User-Driven Exploration
- Drill-down capabilities
Predictive Visualizations
- Future trend projections
How to Utilize the Power of Data Visualization Dashboards
Data storytelling and visualization necessitate a balance between mathematical integrity and aesthetic values. You want to express technically complex ideas without oversimplifying them.
After all, audiences must not lose the sense of urgency or criticality of an issue because of colorful graphics.
You must also avoid filling all infographics with too many details because secondary elements in the visualized reporting methods might distract audiences.
The following considerations can aid you in crafting ideal data visualization dashboards for effective communication.
Remember Your Audiences’ Subject Familiarity and Expectations
How you design a visual data view must depend on who your intended audiences are and what they expect from you. You must know how they might use the communicated information.
Perhaps you are presenting a new perspective on a long-standing issue in your domain to industry peers. They will be comfortable with jargon and references to international standards and research journals.
On the other hand, if you want to use data visualization platforms to educate consumers about product specifications and intended use cases, consider simplifying the content.
Do Not Use a Visual Data View without Assessing Its Impact
Each chart tells a unique story. Unsurprisingly, professionals offering data storytelling assistance recommend studying the suitability of graphs and whether your message truly needs them.
For instance, a bar chart aids in comparing categories. However, it is the line graph that describes non-discrete or continuous variables changing with the passage of time.
You can use donut charts for more detailed contributions, but a pie chart might not accurately present the information.
Therefore, there is no need to use multiple pie charts. Ultimately, the wrong data visualization methods create confusion. They are more likely to misinterpret what the data storytelling team is trying to convey.
Simplification is Good, but Oversimplifying Excludes
Ensuring clarity in communication is the core reason for data visualization tools to exist. Still, misuse of visualized reporting methods is possible.
While design philosophies like minimalism can provide aesthetically pleasing effects, they can also alienate audiences by removing essential metrics from the visualization dashboards.
Balancing designers’ vision with what the intended audiences expect is easier said than done.
Nevertheless, oversimplification often leads to alienation. Audiences will think that you are underestimating their intelligence. Otherwise, there will be accusations of deliberately hiding crucial information with decorative graphics.
Given these downsides, do not make aesthetic effects the top priority. This rule is especially applicable to infographics and case studies used in B2B authority building.
What Are the Key Advantages of Harnessing the Power of Data Visualization?
Making Communication Clear & Simple
Data visualization platforms empower all organizations to reduce the complexity in how they communicate product specifications, troubleshooting tips, and payment plans.
Doing so prevents excessive information delivery that often overwhelms intended audiences. Data visualization significantly refines the content delivery by breaking down complex documentation into comprehensible formats.
Consequently, target stakeholders can arrive at meaningful conclusions and avoid confusion.
Facilitating Quick Conflict Discovery and Decision-Making
Brands want decision-makers to have 24/7 access to concise and actionable intelligence. Thankfully, cloud-hosted data visualization tools provide seamless accessibility and collaboration features.
They let your team members and leaders acquire vital details on a near-instant basis.
In other words, stakeholders waste no time and receive continuously updated visual data views. These visualized reporting methods also let them exchange input for accelerated conflict assessment and resolution.
Increasing Audience Engagement Metrics
A good visual in your data storytelling strategy can be much better at grabbing the right audience’s attention.
It can engage them with the right ideas and help them understand technical aspects without feeling overburdened with tables containing lengthy numerical records.
For illustration, choropleths help describe geographical variations with color schemes, while pie charts quickly demonstrate percentage contributions.
So, your audiences do not need to master various sorts of commands in a feature-rich software tool to interpret the related trends.
Business Applications of Data Visualization
Marketing and Customer Analytics
Customer Journey Mapping
- Visualize customer touchpoints
Campaign Performance
- Real-time campaign metrics
Customer Segmentation
- Demographic and behavioral clusters
Sales and Revenue Analytics
Sales Pipeline Visualization
- Opportunity tracking and forecasting
Revenue Analysis
- Revenue trends and projections
Customer Lifetime Value
- CLV prediction models
Operations and Performance
Operational Efficiency
- Process flow visualization
Supply Chain Management
- Inventory level monitoring
Quality Control
- Defect rate analysis
Best Practices for Effective Data Visualization
Design Principles
Simplicity and Clarity
- Choose the right chart type for your data
Data Accuracy
- Verify data quality and completeness
User Experience
- Design for your audience
Technical Considerations
Performance Optimization
- Efficient data processing
Data Integration
- Connect multiple data sources
Security and Privacy
- Protect sensitive information
Tools and Technologies
Business Intelligence Platforms
Tableau
- Powerful visualization capabilities
Power BI
- Microsoft ecosystem integration
QlikView/Qlik Sense
- Associative data model
Open Source Solutions
D3.js
- Custom visualization development
Python Libraries
- Matplotlib for basic charts
R Visualization
- ggplot2 for statistical graphics
Measuring the Impact of Data Visualization
Key Performance Indicators
User Engagement
- Dashboard usage metrics
Decision Quality
- Faster decision-making cycles
Business Impact
- Revenue growth attributed to insights
ROI Analysis
Implementation Costs
- Software licensing and infrastructure
Benefits and Returns
- Time savings in analysis
Visualization Use Cases for Industries – Turning Complex Data into Actionable Insights
Data visualization tools have multiple business use cases, enabling companies in industries like healthcare, construction, manufacturing, logistics, and education to achieve superior outcomes.
Here is a glimpse into why industries seek the advantages of data visualization and reporting platforms.
How Does Data Visualization Help Healthcare Professionals?
Professionals serving the stakeholders in the health and life sciences industry can leverage the power of data visualization to improve patient recovery outcomes and monitor infectious diseases.
Besides, medical research teams can evaluate the effectiveness of multiple treatment regimens via visualization dashboards and data consolidation.
Consider visual data views depicting vaccination progress versus infection rates when epidemics hit a region.
Having access to those reports helps doctors, laboratories, and pharmaceutical companies estimate inventory and equipment requirements.
Additionally, regulators can have a better grasp of hospitalization capacity. Health insurance providers can also understand individuals’ susceptibility to various disorders using more reliable data insights.
In turn, they can revise insurance plans, increase claim settlement successes, prevent insurance fraud, and improve risk assessments.
Role of Visual Data Views in the Finance and Banking Sector
Financial advisors must stay informed about market trends to enhance how they analyze risks and optimize clients’ portfolios.
Line graphs, heat maps, pie charts, tree diagrams, and other elements in data visualization dashboards can guide them in risk-reward assessments.
Therefore, bankers, investment researchers, and traders can compare sectors without checking extensive numerical datasets.
Borrowers with less likelihood of repaying the lenders and depositors with potential involvement in money laundering or tax evasion cases might be separately monitored via visualized reporting methods.
Visualization also allows banks to help customers study their spending habits and formulate more efficient expense management methods.
Use Cases of Data Visualization to Boost Marketing Performance
Marketers acknowledge the advantages of data visualization in measuring campaign performance and experimenting with multiple customer enrolment strategies.
Analysts help them interpret how customers navigate their commercial web portals. Similarly, user interface designers can find opportunities to streamline customer journeys.
It’s no surprise that leading marketing analytics and customer behavior forecasting tools feature data visualization dashboards with flexible reporting options.
Their capabilities include breaking down each user session and recommending experience optimization strategies.
The reports can also be studied in worksheet-handling programs like Excel or Google Sheets if your team members seek better control over numerical records.
How Educational Institutes Leverage the Power of Data Visualization?
Educators and independent groups of multidisciplinary scholars can examine socioeconomic and ecological events with appropriate platforms offering data visualization capabilities.
In addition to enhancing the quality of test results and lectures, educational institutes can also track student progress metrics.
On a much larger scale, public administration can capture insights into literacy, numeracy, and technical skills per age group in a specific region.
More holistic data on academic performance can equip educators with the necessary information to revise curricula based on employability concerns.
Later, the gap between what universities teach and what corporations expect from young recruits will decrease.
As a result, teachers, parents, students, employers, and scholars will have more outcome-oriented educational settings.
Industries will also have ease of talent acquisition as finding the right talent becomes less of a hassle.
Future Trends in Data Visualization
Advanced Technologies
Augmented and Virtual Reality
- Immersive data exploration
Artificial Intelligence Integration
- Automated insight generation
Real-Time and Streaming
- Live data visualization
Emerging Applications
Big Data Visualization
- Large-scale data processing
Mobile and Responsive
- Mobile-first design principles
Collaborative Analytics
- Shared dashboards and reports
Challenges and Solutions
Common Challenges
Data Quality Issues
- Inconsistent data formats
User Adoption
- Resistance to change
Technical Limitations
- Performance with large datasets
Solutions and Strategies
Data Governance
- Establish data quality standards
Change Management
- Comprehensive training programs
Technology Selection
- Choose appropriate tools for your needs
Conclusion
The power of data visualization allows leaders to enhance their ability to turn complex data into practical, actionable insights, improving how they communicate with stakeholders.
Data storytelling allows for an ease of sharing acquired knowledge with industry peers. Meanwhile, simplified data visuals enhance the effectiveness of consumer education campaigns.
Evidence validated by reputed scholars worldwide has already proved the role of visual elements in human cognition, memory retention, and communication effectiveness.
In response, more enterprises in healthcare, education, finance, and engineering are embracing data visualization platforms for collaborative report creation.
At the same time, irresponsible use of visualization dashboards risks losing audiences’ faith in your brand. After all, a pursuit of simplification and eye-catching visuals must not hinder their access to vital decision-making processes.
Fortunately, more people now recognize the risks of oversimplification. With more advanced technologies modernizing visualized reporting methods, leaders can safely discuss ideas, train team members, and engage audiences with precise, user-friendly dashboards.
Ready to transform your data into powerful visual insights? Schedule a free consultation with our data visualization experts to discover how we can help you create compelling visualizations that drive better business decisions and outcomes.