

Product profitability analysis determines the profit that each product, SKU, or product line produces after subtracting the costs generated by the product.
It shows which products add to the total profit and which reduce it.
Revenue rankings and blended margins do not show this. A best-selling product can carry shipping, return, and advertising costs that never appear in its gross margin. SKU profitability analysis assigns those costs back to the product that caused them.
What Is Product Profitability Analysis?
Product profitability analysis compares the revenue from each product with the costs attributable to it, then ranks products based on the remaining profit. The unit of analysis can be a single SKU, a product line, or a category. Other names for the practice include product margin analysis, product profit analysis, item profitability analysis, and profit by product reporting.
Product-level profitability differs from the totals on a company's profit and loss statement (P&L). The P&L reports one blended margin for the whole business. Product profitability shows how far that margin varies from one SKU to the next.
For retail and e-commerce teams, product profitability analysis informs pricing and assortment decisions. You can reprice or remove products that cost more to sell than they earn. You can also direct more inventory and advertising toward the products that keep more of their margin.
Product profitability analysis groups costs by product. Customer profitability analysis applies the same logic to customers and segments, and many companies run the two together.
Product Profitability Metrics and Formulas
The basic product profitability formula is product revenue minus the costs attributable to that product. When you work out how to calculate product profitability, the first decision is which costs to include.
Each of the product profitability metrics below includes more costs than the one before it. That is why the same product can rank differently on each metric.
Gross Margin Analysis
Gross margin is net revenue minus cost of goods sold (COGS), the purchase or production cost of the units sold. Gross margin analysis compares that figure across products, in dollars and as a percentage of revenue. Gross profit margin analysis is the same comparison expressed as a ratio.
Gross margin is the quickest view, because revenue and COGS by SKU are usually available in the order and inventory systems. Its main limitation is the costs it excludes. Shipping, fulfillment, payment processing fees, returns, and advertising all sit below the gross margin line.
Contribution Margin Analysis
Contribution margin is the revenue left after deducting all variable costs from sales.
In e-commerce, those variable costs typically include fulfillment, shipping, payment processing fees, returns, and the paid media attributed to the product. Contribution margin analysis ranks products by what each one contributes toward fixed costs and profit.
The method for calculating contribution margin per unit is to subtract the variable costs of one unit from its net selling price. Multiply the result by units sold to get the product contribution margin for the period. Dividing contribution margin by revenue gives the contribution margin ratio, which lets you compare a $20 product with a $200 one.
Reporting contribution margin by product requires assigning each variable cost to the SKU that caused it, which is difficult when shipping and returns are recorded per order.
Gross Margin vs. Contribution Margin
Gross margin shows whether a product is priced well against what it costs to buy or make. Contribution margin shows whether the product makes money once it has been shipped and kept by the customer. The gap between the two is typically widest for bulky, fragile, or frequently returned products, and for products that depend on paid media.
In product profitability analysis, gross margin suits buying and pricing discussions with suppliers. Contribution margin is the better basis for decisions about assortment, promotion, and advertising spend.
Product Profitability Analysis Methods
The metrics above depend on how costs are assigned to products. Four product profitability analysis methods approach that question in different ways.
Cost Allocation and Activity-Based Costing
Some costs belong clearly to one product, such as its purchase price. Others are shared, such as warehouse labor, customer service, and storage space. Cost allocation methods decide how those shared costs are divided among products.
A basic method spreads shared costs by revenue or units. That approach tends to undercharge products that are complex to handle. Activity-based costing (ABC) assigns shared costs according to the activities each product consumes, such as picks, packs, and customer service contacts.
An activity-based costing product profitability model is the common route to a fully loaded product cost. Traditional ABC can be difficult to implement and maintain in large operations, according to Robert Kaplan of Harvard Business School and Steven Anderson. Their alternative is time-driven ABC, which needs two estimates for each group of resources: the cost per minute of capacity supplied and the time each activity takes.
Direct Product Profitability
Direct product profitability (DPP) is a retail measure of the profit on individual products and categories. The Universal Marketing Dictionary, published by the Marketing Accountability Standards Board, defines it as adjusted gross margin less direct product costs. Adjusted gross margin adds supplier allowances and promotional income to gross margin.
Grocery retailers have used DPP for decades. A study of grocery retailers in the Journal of Food Distribution Research notes that the Food Marketing Institute released a unified DPP model in 1985, with warehousing, transport, and in-store handling as the direct costs.
The same study warns against reading DPP as a break-even price, because it excludes indirect costs such as checkout labor and store management.
Cost-to-Serve Analysis
Cost-to-serve analysis measures what it costs to deliver a product through each channel, order type, and fulfillment route. The same SKU can earn a positive margin on your own website and lose money on a marketplace once referral fees, fulfillment fees, and advertising are counted.
For that reason, product profitability by channel often differs from a product's blended figure, and product profitability analysis should report both. Channel profitability analysis splits each product's contribution margin across your direct-to-consumer (DTC) site, marketplaces, wholesale, and stores. You can then set prices and allocate inventory for each channel separately.
The Whale Curve
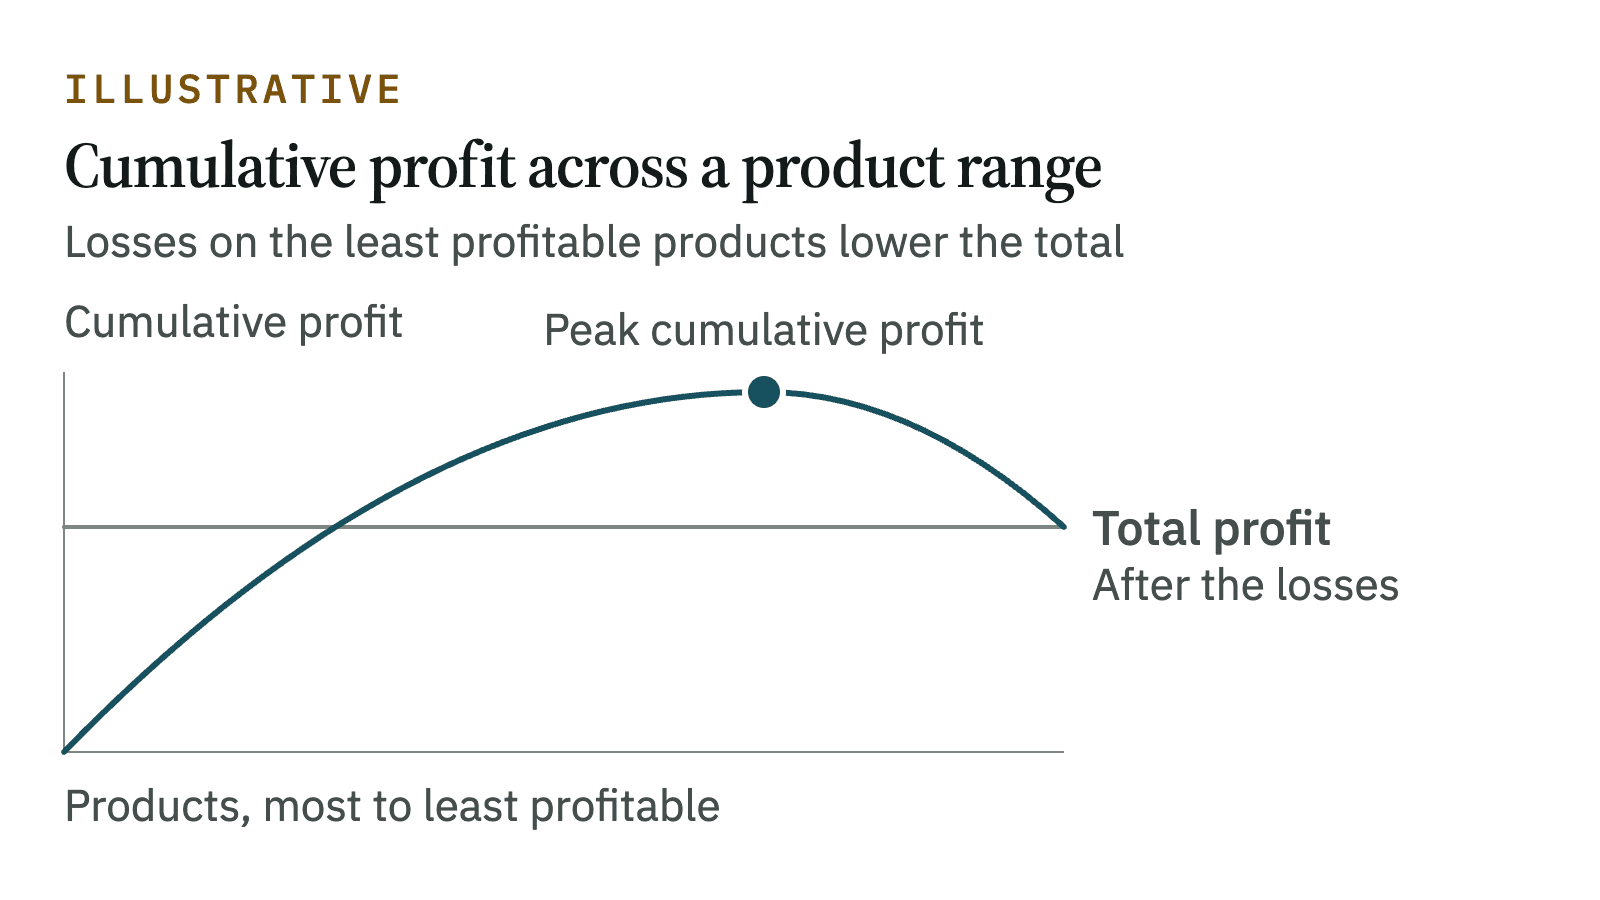
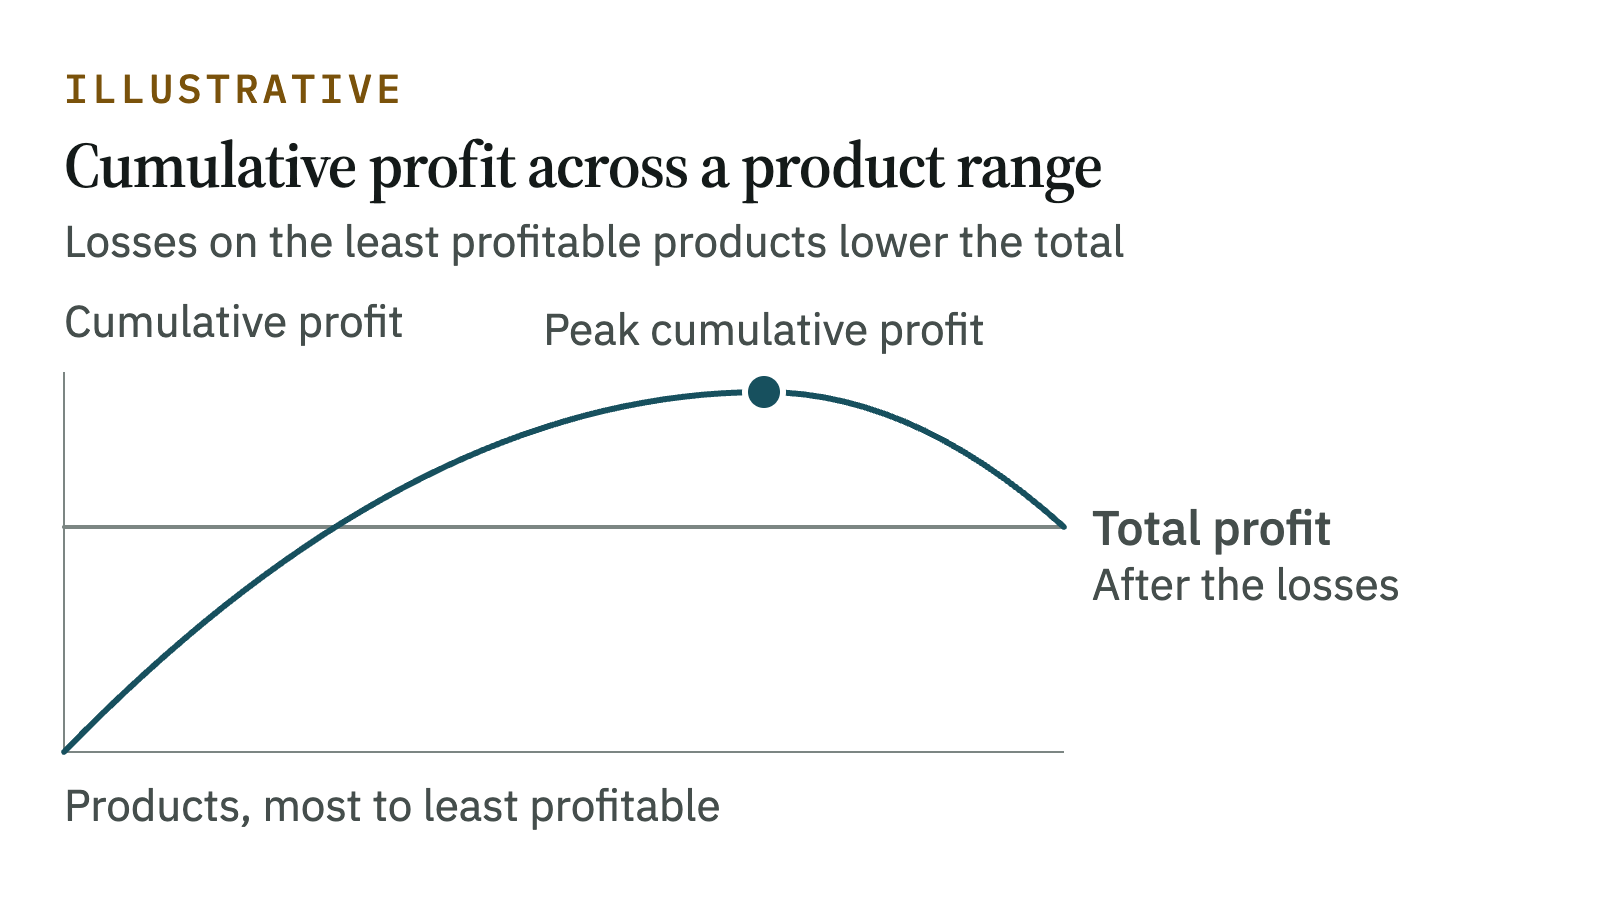
A whale curve is a standard output of product profitability analysis. It ranks products from most to least profitable and plots their cumulative profit. When some products lose money, the line rises above 100% of total profit and then falls back as those losses are subtracted.
Kaplan and Anderson describe the whale curve of cumulative customer or product profitability as the single best picture an ABC model produces.
A Pareto chart of products ranks them by revenue or volume. Ranking by profit shows how large the losses at the right-hand end of the curve are. A revenue ranking does not reveal them.
How to Perform Product Profitability Analysis
These steps apply whether you work in a spreadsheet or a data warehouse. The difference lies in how often you can repeat them.
- Choose the unit of analysis. SKU profitability analysis gives you profit per SKU, while product line profitability analysis is easier for buying and merchandising teams to act on.
- Start from net revenue. Deduct returns, discounts, and markdowns from gross sales for each product.
- Assign direct costs. Use landed cost, which includes freight, duties, and insurance, rather than the supplier's unit price. Then add fulfillment, shipping, and payment processing fees per unit.
- Allocate shared costs. Choose a cost allocation method and apply it consistently, so you can compare results from one period to the next.
- Rank products and act on the results. Product mix analysis and product portfolio analysis show where to shift inventory and spend. Products at the loss-making end become candidates for repricing, reduced promotion, or SKU rationalization.
Repricing decisions can draw on price optimization, which estimates how demand responds to price changes. For products with volatile demand, dynamic price optimization adjusts prices more often. For seasonal stock, markdown optimization sets the timing and depth of each price cut.
Product Profitability Analysis Example
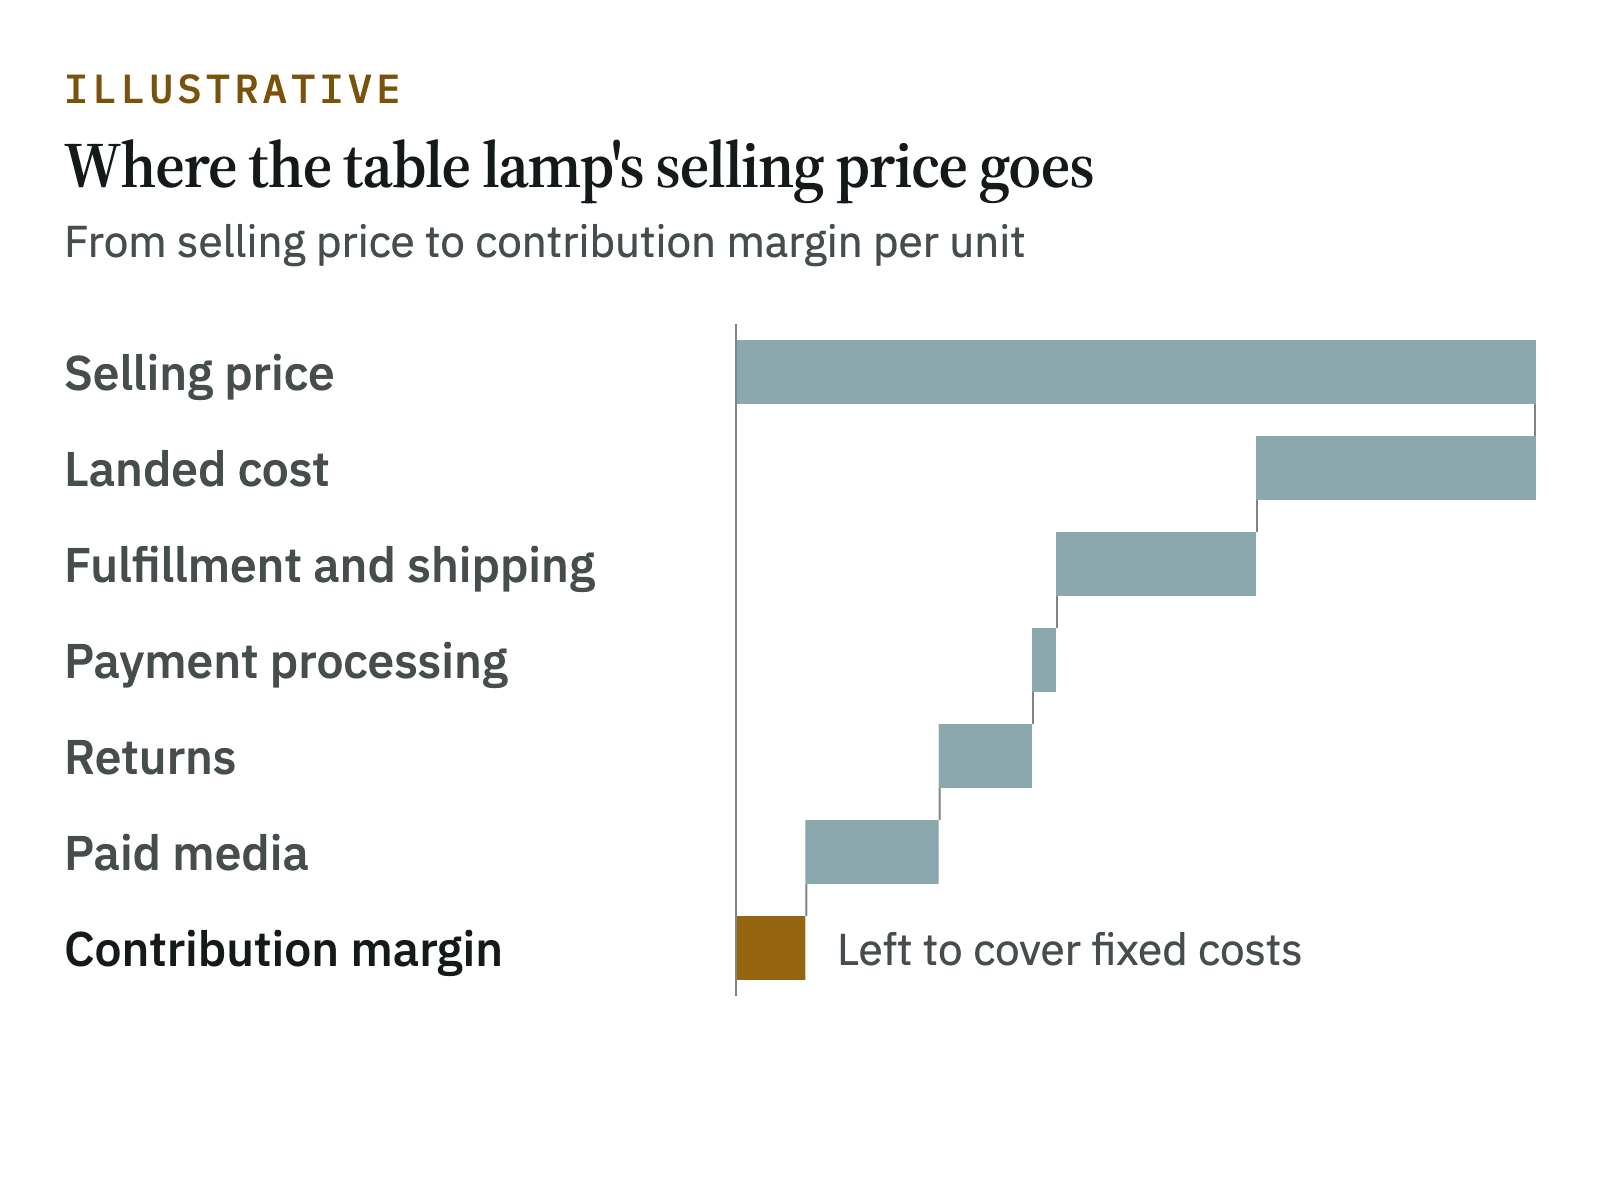
Say a home goods retailer sells two products online: a table lamp at $120 and a throw pillow at $40. The figures are hypothetical.
| Table lamp | Throw pillow | |
|---|---|---|
| Selling price | $120.00 | $40.00 |
| Landed cost | $42.00 | $18.00 |
| Gross margin per unit | $78.00 (65%) | $22.00 (55%) |
| Fulfillment and shipping | $30.00 | $6.00 |
| Payment processing | $3.60 | $1.20 |
| Returns (average per unit sold) | $14.00 | $1.20 |
| Paid media (attributed) | $20.00 | $4.00 |
| Contribution margin per unit | $10.40 (8.7%) | $9.60 (24%) |
| Units sold per year | 5,000 | 8,000 |
| Revenue | $600,000 | $320,000 |
| Total contribution margin | $52,000 | $76,800 |
Gross margin analysis ranks the lamp first, at 65% against 55%. Contribution margin analysis reverses the order, because the pillow generates $76,800 of contribution margin on about half the lamp's revenue.
The lamp still makes money. It is bulky to ship and returned more often, though, so a carrier rate increase or a higher return rate could take its contribution margin below zero.
Product Profitability in Retail and E-commerce
Retail product profitability depends heavily on costs that occur after the sale, and returns are one of the largest. The National Retail Federation (NRF) and Happy Returns estimated that 19.3% of online sales would be returned in 2025.
Each return adds reverse shipping, inspection, and restocking or write-off costs to the product that was sent back, so product profitability analysis has to net returns out at the SKU level. E-commerce product profitability also depends on marketplace fees, free-shipping thresholds, and the paid media attributed to each product. Together, these per-unit figures are often called e-commerce unit economics.
Product unit economics that look sound at launch can deteriorate as advertising costs rise or as a product moves into a higher shipping tier. Margin leakage is the difference between the price planned for a product and the margin it generates in practice.
Typical sources include unplanned discounts, stacked promotions, damaged stock, and chargebacks.
Store-based retailers often add gross margin return on investment (GMROI), which compares a product's gross margin with the average cost of the inventory held to sell it. CPG product profitability adds trade spend and retailer allowances to the cost stack. In manufacturing, production line profitability analysis also accounts for changeover time, scrap, and machine capacity.
What Product Profitability Analysis Needs From Your Data
The calculations in product profitability analysis are simple. Assembling the inputs is harder, because the costs for one SKU sit in different systems.
Revenue and returns come from the e-commerce platform or point of sale, and landed cost comes from the ERP. Shipping comes from the carrier or third-party logistics (3PL) provider, and advertising spend comes from each ad platform. Each system identifies products differently, and some record costs per order rather than per SKU.
Until those records are joined and allocated consistently, a product P&L, a product profitability report, or a product profitability dashboard will show different numbers depending on who built it. Joining and allocating those records is usually where our work starts. Data consolidation brings the sources into one model, so the allocation rules your finance and merchandising teams agree on apply to every report.
We build the product profitability analytics on your platform, as part of our data engineering solutions. With reliable inputs, you can refresh the product profitability model on a schedule instead of rebuilding it each quarter.
Where you start with product profitability analysis depends on one question. Do you have a data warehouse or lakehouse with your key data sources already consolidated into it?
If not, or only partly, the Data Readiness Assessment checks whether your data can support the analysis. If you do, the AI Readiness Assessment verifies whether that foundation is ready for forecasting and automated decisions.
Final Thought
A revenue ranking and a profit ranking of the same catalog often differ. Product profitability analysis shows where they differ and which products justify further investment.
Repeat the analysis whenever costs or channels change. If your cost data is spread across systems, consolidating it is the first step.
Get in touch to talk about a Data Readiness Assessment, or about building product profitability reporting on the platform you already own.