

The marketing team walks into the weekly performance meeting feeling pretty good about the numbers because Google Ads is showing an 8:1 ROAS and Meta a 6:1 ROAS.
Then the CFO asks a simple question: "If marketing is performing so well, why aren't we seeing it in the bottom line?" Suddenly, those impressive ROAS numbers aren't quite so reassuring.
Every advertising platform has its own version of success. Each can claim credit for conversions, including purchases from customers who might have bought anyway. Add those numbers together, and platform-reported ROAS may tell a very different story from what the business is experiencing.
The number that matters is iROAS, or incremental return on ad spend: the revenue your advertising caused, not the revenue it was credited with.
This is precisely the problem marketing mix modeling (MMM) is designed to help address. By examining marketing investment alongside sales, customer demand, seasonality, and other external factors, MMM helps estimate each channel's iROAS: which channels are genuinely contributing incremental growth, and where the next marketing dollar is likely to deliver the greatest return.
But a model that simply explains historical sales isn't enough. It needs to be validated, account for external demand drivers, and connect marketing decisions to actual financial performance.
At Express Analytics, the real test of MMM isn't how well a model explains yesterday's sales. It's whether it helps leadership make smarter investment decisions tomorrow, before competitors recognize the same opportunities.
What Is iROAS?
iROAS, short for incremental ROAS or incremental return on ad spend, measures the revenue your advertising caused, divided by what it cost. Platform ROAS divides all the revenue a platform claims by spend, including purchases that would have happened anyway. iROAS counts only the difference between what happened with the ads and what would have happened without them.
How to Calculate iROAS
The iROAS formula is simple: incremental revenue divided by ad spend. The hard part is the numerator, because incremental revenue can't be observed directly. It has to be estimated, either with a controlled experiment or with a model that separates baseline demand from marketing's effect.
Here's an iROAS calculation in practice. Say a channel spends $100,000 and reports $600,000 in attributed revenue, or 6:1 ROAS. An independent incrementality analysis estimates that the advertising actually generated $350,000 in additional revenue. That produces an iROAS of 3.5:1.
iROAS vs. ROAS
ROAS tells you how much revenue a platform credits to its ads. iROAS tells you how much revenue those ads created. The two drift furthest apart where ads reach people who were already likely to buy: retargeting, branded search, and existing customers.
That's why, in most ROAS vs. iROAS comparisons, iROAS comes in lower. The gap between the two shows how inflated ROAS has become, and ranking channels by iROAS can change which ones deserve more budget.
The Challenge Isn't Just Measurement. It's What Happens Next.
In a Google-sponsored survey of 547 marketers by Harvard Business Review Analytic Services, 87% of respondents say MMM is important to their organization, yet only 28% say they're very effective at turning those insights into timely action.
That gap is why modern marketing mix modeling must go beyond reporting channel performance. The value comes from translating measurement into budget decisions that are agile enough to improve business outcomes, which is the focus of our decision intelligence services.
Source: Harvard Business Review Analytic Services, "Bridging the Marketing Mix Modeling Actionability Gap," sponsored by Google. Survey of 547 marketers, September to October 2025.
How Express Analytics Uses Modern MMM to Measure Incremental Returns
Every engagement follows the same five stages, in order.
Data foundation. We start by checking the data for every channel: spend, delivery, and the business outcomes you track. We then clean, align, and transform it into one consistent, model-ready format.
Feature engineering. Raw spend rarely tells the whole story. We account for adstock and carryover effects, recognizing that advertising can influence purchases long after an impression. We also model saturation curves to identify diminishing returns as channel investment increases.
External context. Marketing does not run in a vacuum. We bring in seasonality, macroeconomic indicators, and competitor activity where available. For brands investing across the full funnel, we also consider how awareness-building activity may influence demand that lower-funnel channels eventually capture. This helps distinguish the impact of marketing from broader market conditions and supports a more complete approach to full-funnel marketing measurement.
Modeling. We run the prepared data through a proprietary hybrid approach that combines multiple modeling frameworks. Drawing on more than one model gives a more balanced read than relying on any single one.
Decisioning. We translate model results into marketing budget recommendations using marginal ROAS (mROAS), which estimates the return on the next dollar invested rather than the average return on past spending. iROAS tells you what a channel's spend has returned, and marginal ROAS tells you what the next dollar will return. Where financial data supports it, we also evaluate marginal ROI to understand the potential profitability of additional investment. Scenario planning allows marketers to evaluate different budget allocations before committing investment.
"The most dangerous marketing decisions aren't always the ones that fail. They're the ones that appear to succeed because we're measuring the wrong outcome. You can improve ROAS for months while systematically starving future demand by cutting back on prospecting and concentrating spend on customers who were already likely to buy. That's the trap: the numbers keep validating your decisions, right up until the business stops growing."
Scott Rosenbloom, Chief Marketing Officer, Express Analytics
What You Get From the Model
You receive a recommended media mix and a forward budget plan, backed by channel-level insight.
- Ideal media mix: the recommended split of budget across channels for your objective.
- Channel-level contribution and returns: what each channel has delivered, its iROAS, and where additional spend is likely to return more or less.
- Budget allocation projection: how to distribute future ad spend, and what each plan is expected to deliver.
Turning Marginal ROAS Into Budget Decisions
The example below illustrates how MMM can recommend reallocating marketing spend across channels based on modeled iROAS and diminishing marginal performance. Rather than simply increasing the overall budget, marketers can identify opportunities to shift investment toward channels with greater potential for incremental growth.
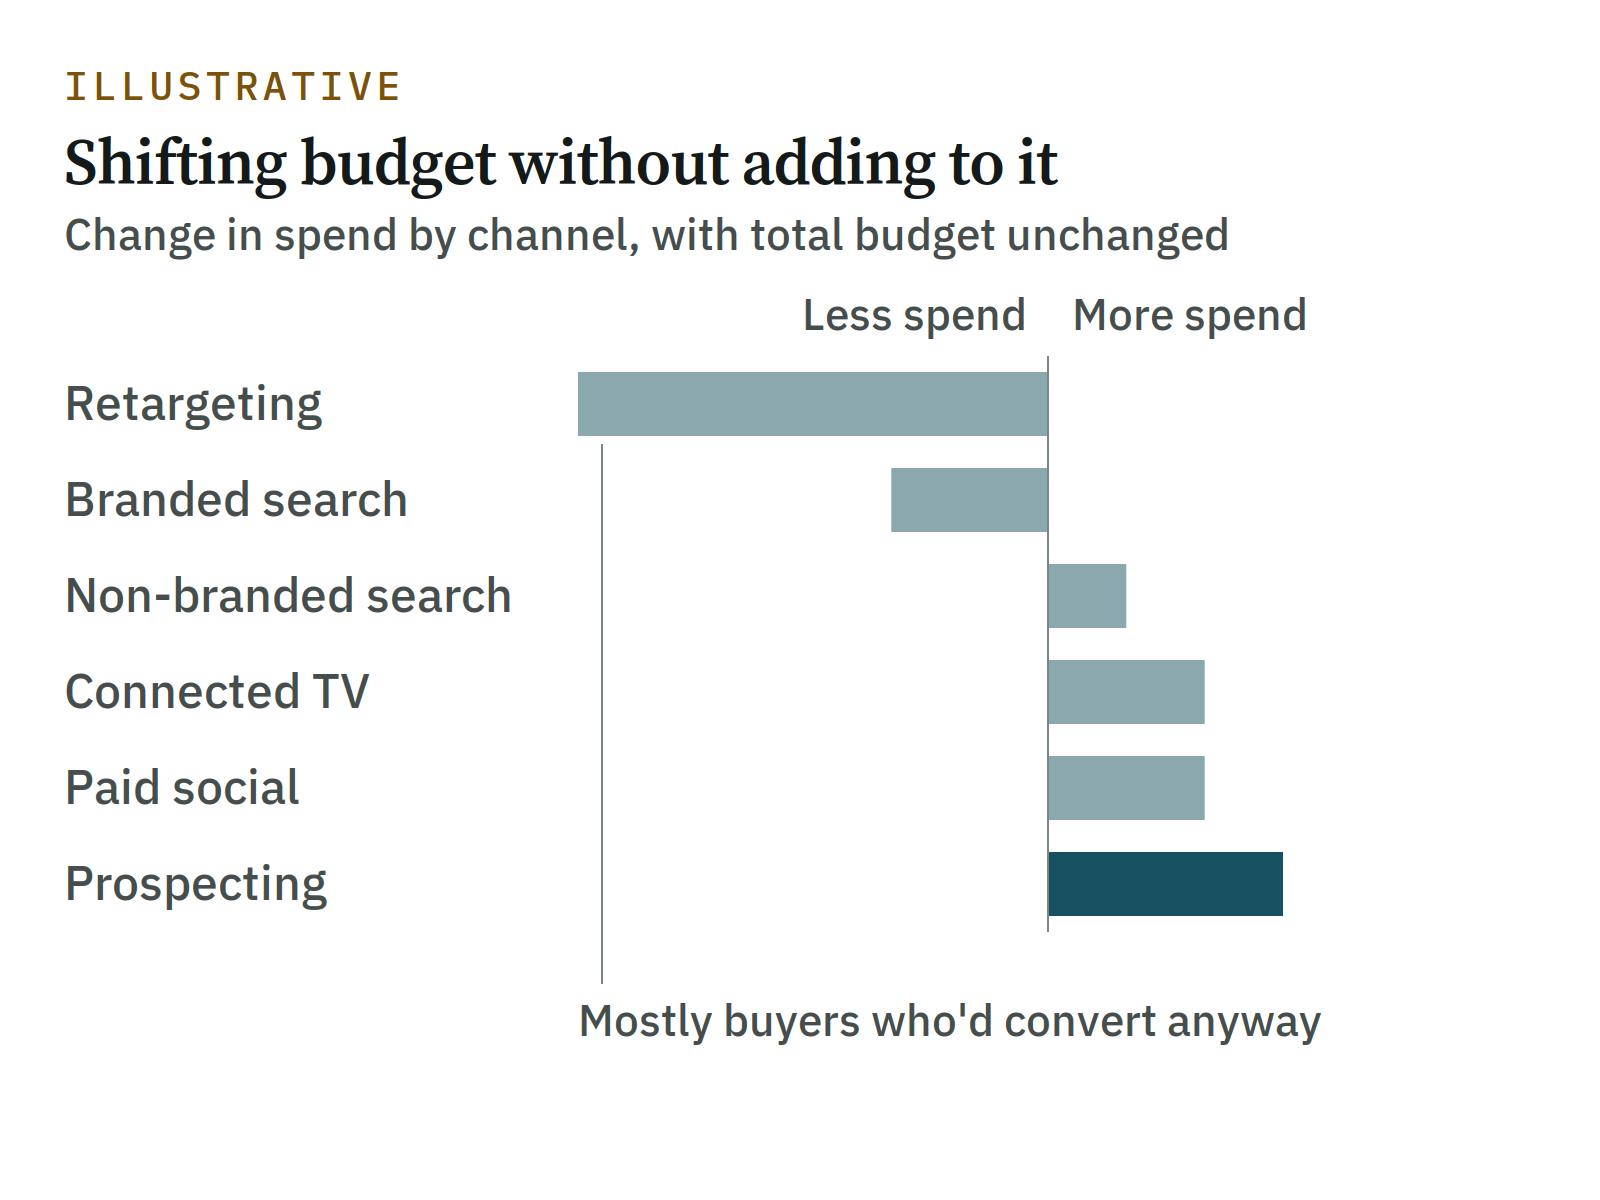
Illustrative budget optimization output. Actual recommendations depend on business objectives, model assumptions, and available data.
What to Expect From Modern MMM
Buyers judge an MMM on three key questions: is it validated, how quickly does it update, and does it improve financial performance? Here is how we answer each one.
Validated: Evidence, Not Just Fit
How do you know the credit given to each channel is real? Where the data supports it, we calibrate our models against causal evidence, such as geo-lift tests and conversion-lift experiments. We also show confidence ranges around our recommendations, so you can see how much weight each one deserves.
This reflects a broader shift toward unified marketing measurement, where MMM, attribution, and incrementality testing work together to provide a more complete picture of marketing effectiveness.
Watch out: A model can fit historical performance remarkably well and still misattribute results. When brands increase advertising during periods of naturally higher demand, the model may credit media for sales that would have happened anyway. Incrementality experiments, such as geo-lift tests, provide independent evidence to help validate and calibrate the model's iROAS estimates.
Current: A Model That Keeps Pace
How fresh is the model? We refresh models monthly or more often, so recommendations reflect your latest spend, market shifts, and seasonality instead of last year's picture. Marketers can also run interactive what-if budget scenarios, such as shifting spend between channels or changing the overall budget, and see the projected effect before committing money.
Profitable: ROAS vs. ROI
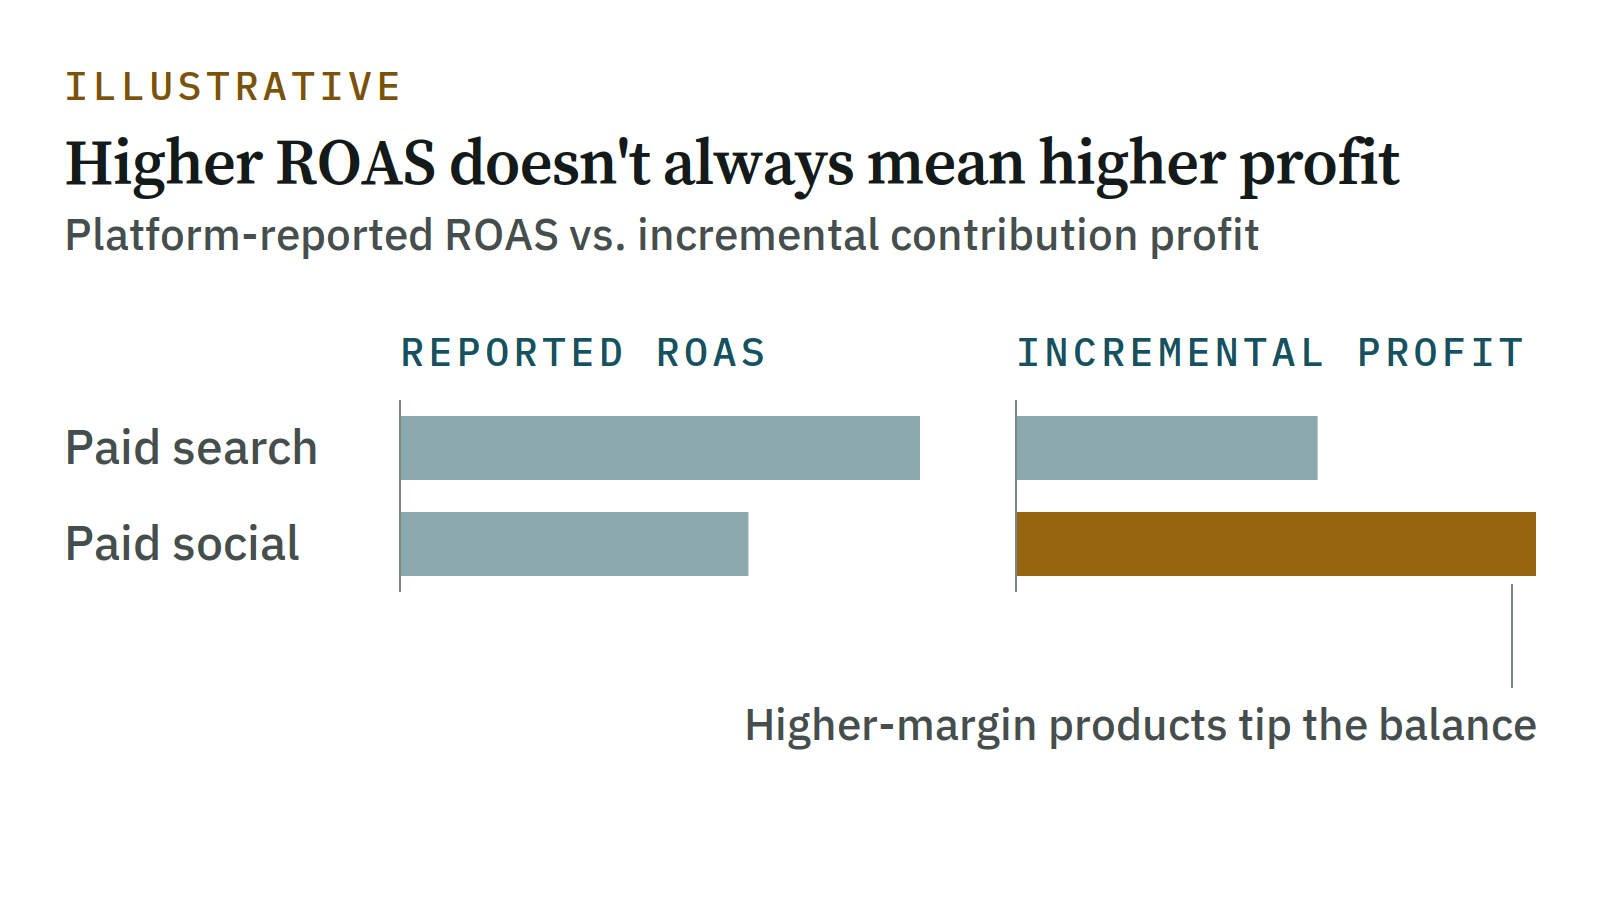
ROAS measures revenue per ad dollar. ROI measures profit. A channel with the highest ROAS isn't necessarily the one generating the most profit, because product margins, discounts, fulfillment costs, and customer acquisition economics can materially change where the next marketing dollar should go.
Where sufficient data is available, we incorporate contribution margin and customer lifetime value to help CMOs and CFOs align marketing investment with financial performance. The result is a clearer understanding of which channels drive incremental profit, not just revenue, and where to allocate budgets for more profitable growth.
Consider an example. A retailer discovers that paid search produces a higher ROAS than paid social, but paid social generates greater incremental contribution profit because it drives purchases of higher-margin products. Our MMM can recommend shifting a portion of the marketing budget, with projected outcomes and confidence ranges.
What Makes Our MMM Approach Different?
Most marketing measurement approaches start with a predefined model. At Express Analytics, we start with your business decisions. This approach allows us to connect marketing, customer, transaction, and financial data to build a completely custom MMM tailored to your business economics and objectives.
Whether the priority is incremental revenue, contribution margin, customer lifetime value, or more efficient budget allocation, we design the measurement framework around what matters to you, rather than around a one-size-fits-all platform.
Is MMM Right for You?
MMM suits brands that spend across several channels and want to set budgets with confidence. It works best when you have:
- Spend and outcome data for each channel over an extended period, so the models can learn across seasons.
- Meaningful variation in spend over time, rather than a flat budget.
- A clear outcome to optimize toward, such as sales, revenue, or conversions.
We handle the data preparation and bring in the external context ourselves.
A marketing data warehouse that already consolidates these sources turns that work into a one-time job and lets you refresh the model automatically. If your data isn't consolidated yet, we recommend you start with one of our core data architecture services as a prerequisite.
Final Thought
Platform ROAS will keep looking good, because each platform grades its own work. iROAS asks the question your CFO is already asking: what did the advertising add? Answering it takes a model built on your own data, validated against experiments, and tied to margin as well as revenue.
Get in touch to start with a Data Readiness or AI Readiness Assessment. We'll show you whether your data can support a model that measures iROAS, and what to fix first.